Appendix

Figure 8
X-axis = Total technology usage at work
Y-axis = Total technology usage at home
Z-axis = Race (Black; unknown; other; Asian – white has been excluded)
Red = Male
Blue = Female
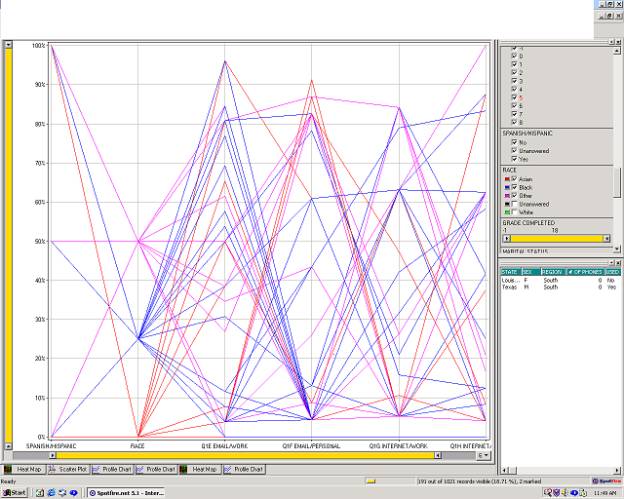
Multiple attributes, from left to right”
Spanish/Hispanic
Race (White excluded)
Minutes using E-mail for work
Minutes using E-mail for personal use
Minutes using Internet for work
Minutes using Internet for personal use

Same as above – but white (green lines) included
Multiple attributes, from left to right”
Spanish/Hispanic
Race
Minutes using E-mail for work
Minutes using E-mail for personal use
Minutes using Internet for work
Minutes using Internet for personal use