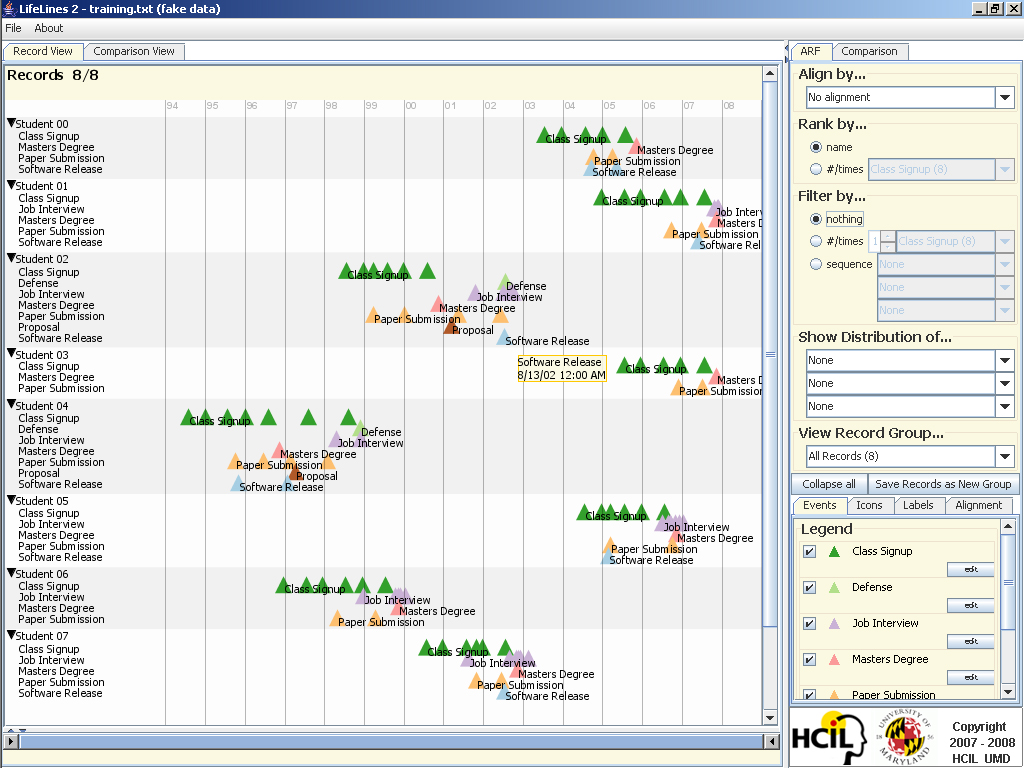
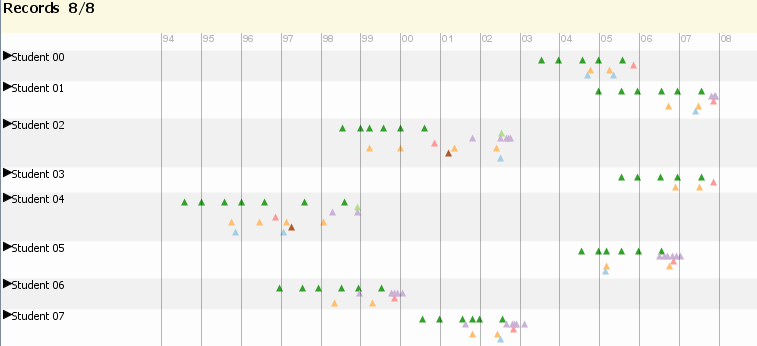
Lifelines2 is split into two main tabs: "Record View", and "Comparison View". Record View provides the operations for users to manipulate records, their ordering and visual display for careful examination, while Comparison View gives users tools to compare within a set of records or across a set of records. We use a sample file (included in the distribution) of simulated student records to illustrate the features of the tool. The initial screen shot of the data is as follows:
The right side is the control panel, where most of user actions are performed. The left side is the area where the visualizations are displayed. The screen shot shows the Record View of data, where each record is put on a timeline for display. The time line is displayed at the top, and for this dataset, each tick represents a year initially. Users can left click on the main display to zoom in, and right click to zoom out. Double click on the column of record ID's or the bottom slider resets the view. Users can also use the slider at the bottom to zoom by dragging the ends (either side) of the slide towards center. When the slider is small, dragging the body of the slider left or right results in panning. Mousing over each individual events (triangles) will show the details of that event.
Record View Tab
| Operation | Explanation |
| Align |
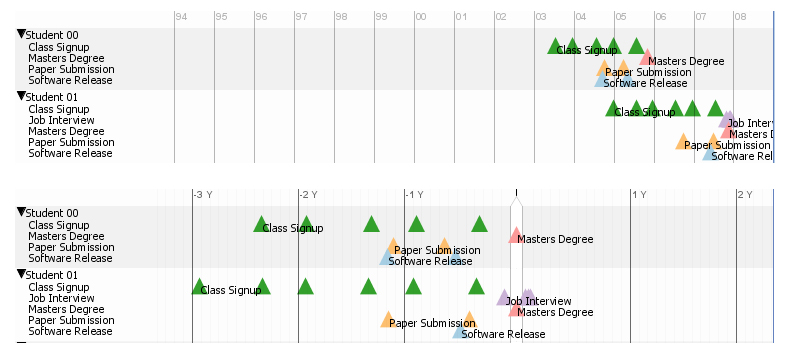
Aligns a selected event across records on the same vertical line. Records that do not have the specified event is filtered out. The default alignment is "none", that is all records are displayed on calendar timeline. The image below illustrates how alignment works.
Top: Unaligned Bot: Aligned by 1st Master Degree. Notice the pink triangles lined up vertically, and that the time scales change from absolute calendar time to a relative time (relative to the alignment). (click to enlarge image). |
 |
|
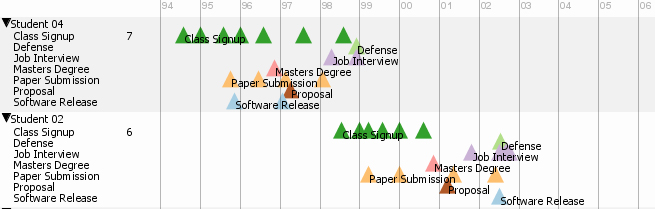
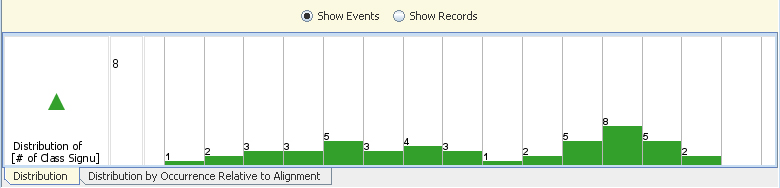
| Rank | Ranks the records by
a selected criterion. The default is to sort the records by the
record ID, but users can select to sort the records by the number of
occurrence of an event category.
The image blow shows the records ranked by the number of occurrence of Class Signup events. Note the numbers next to the event label show exactly how many events there are in that record. This number only displays the event that is being ranked. |
|
|
|
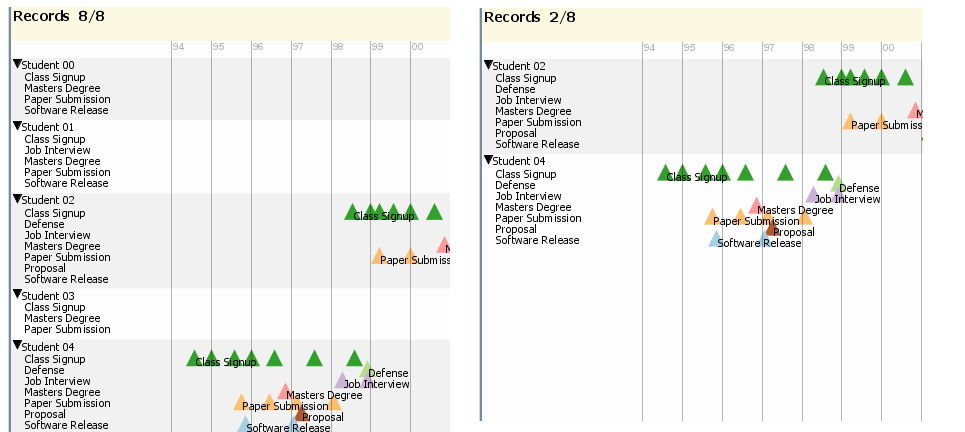
| Filter | Filters the records
by a selected criterion. The default filter is "none" --
show all records. Users can select a criterion so that the records
that do not contain such criterion are filtered out (not shown).
There is a Number-of-Occurrence Filter to allow users to keep only
records that contain at least N number of occurrence of a specified
event category. There is also a Sequence Filter to allow users to
keep only records that contain a specified sequence of event categories.
The image below shows the unfiltered data (left), and the filtered data (right). The filter criterion is "At Least 1 occurrence of the event Proposal". The number of records is reduced from 8/8 to 2/8, and exactly 2 records are shown. |
 |
|
| Show Distribution | Displays the distribution of a specified event category over time (Temporal Summary). Users can further choose to display the event distribution or the record distribution. Up to 3 event categories can be selected, however, first selected event is considered the "primary" one. The number right of the label shows how many records are in that summary, in the example below, there are 8. |
 |
|
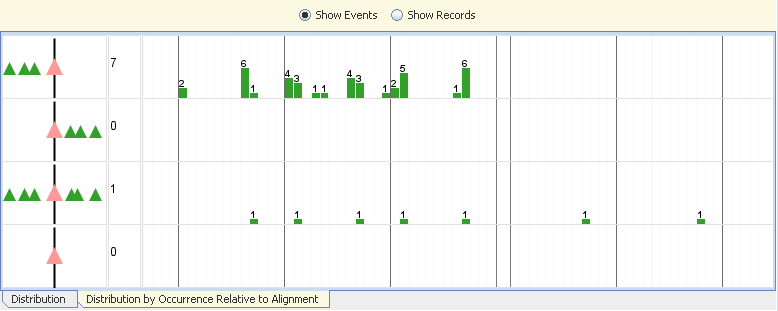
| Additionally, there is an additional tab in the distribution display "Distribution by Occurrence Relative to Alignment". This tab requires an alignment chosen. The tab displays 4 distributions over time. All records are split into 4 exclusive sets: (1) Those that contain the primary distribution event only before the alignment, (2) those that contain the primary distribution event only after the the alignment, (3) both before and after, and (4) neither before nor after. If a record has primary events only before the alignment, and also primary events at the same time as the alignment, the record is classified into the first group. That is, in deciding which set a record falls into, the primary events occurring at the same time as the alignment does not affect the decision. Note that the 4 exclusive sets are decided only by the primary event, but the summary of other distribution events are shown. | |
 |
|
| View Record Groups | Allows users to select which record groups to view. See "Save Group" below to see how to create groups. |
| Collapse All/Expand All | Toggles the display to show the collapsed view or the expanded view of records. Below shows the collapsed view of all 8 records. Note the event category labels are gone. So are in-display texts. |
 |
|
| Save Group | Allows users to save groups after align or filter. For example, a dataset with 60 records are filtered out to have only 40 records. A user may choose to save the group of 40 records for later use. |
Comparison Tab
In the Comparison Tab, users are required to choose 3 "ingredients": What kind of comparison (e.g. Within Group, Between Group, Both), What are the data (e.g. What kind of Splits for Within Group? What groups for Between Group?)?, and what are you comparing (What event categories)?
| Operation | Explanation |
| Comparison Type | The users can specify what type of comparison to perform. There are 3 types: Within Group, Between Groups, and Both (mixed). In Within Group, a user can dynamically select splits (see below) to compare a group split according to a criterion. In Between Group comparison, users can choose prior-selected groups for comparison. In Both, a mixture is used. Unfortunately, Between Group and Both are not implemented yet. |
| Align | It is essentially same as the Align operation as in the Record View. The difference is that it operates on all groups. |
| Split | Allows users to split a group of records into several distributions. The default is no split. "Distribution by Occurrence Relative to Alignment" is discussed in the "Show Distribution" section above. Users can use also "Event Presence/Absence" to split records. By selection the occurrence N and the event category, the user is specifying the records to be split into two sets: one set contains all records that have at least N occurrences of that event category, and another set that contains all records that do not have at least N occurrences of that event category. |
| Distribution of | Users can specify what evet(s)'s distribution to show . |