Introduction to Treemap
Ketan Babaria
HCIL, Computer Science Department
University of Maryland
College Park, MD, 20742
e mail: kbabaria@glue.umd.edu
1. Introduction
Imagine a hard drive in a computer that has hundreds of directories and
each directory in turn has hundreds sub-directories and so on and then at
the end, each of the leaf directories has files of varying sizes. Now say
users' want to know
-
Which directory is taking up most of space?
-
What is the approximate ratio of space taken up by root
directories?
-
What types of files are there in each directory?
Windows Explorer (or similar tool) is a possible tool for finding such information
but it's cumbersome when the number of files is large and it is impossible
to see a global picture. For such cases Treemap is a powerful visualization
tool. Treemap visualization method maps the hierarchy into 2 D space [Ben
S]. It partitions the space into boxes where the size of the box is proportional
to the 'size by' criteria specified by users', in above case, size of the
directory / files.
This paper is an introduction to treemap.
2. Tutorial
Tree visual structures usually represent hierarchical data in two ways, by
using connection or by using containment. Trees shows link between nodes and
its sub nodes and one common way to do this is by drawing connecting lines
between nodes and its sub-nodes, for example we show family tree using this
technique.
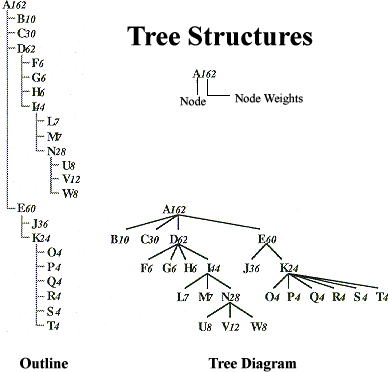
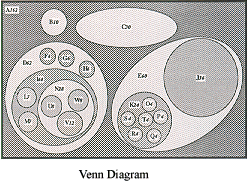
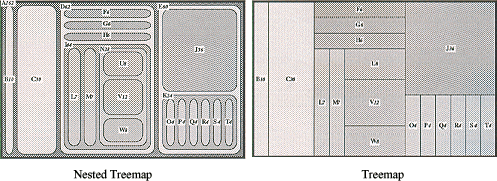
Figure 1: Visualizing hierarchy [1]
Although this method is very easy to implement and interpret,
it has two drawbacks: 1. Space is wasted in visually organizing the nodes.
2. As trees get large they may require an extreme aspect ratio that makes
it difficult to display. The treemap visualization technique, developed by
Ben Shneiderman at HCIL, University of Maryland College Park, presents a novel
method to respond to visualizing hierarchical information. The Treemap visualization
method maps hierarchical information to a rectangular 2-D display in a space-filling
manner so that 100% of the display space is utilized. In this method nodes,
whose attributes are of more importance are given more display area. Users
have the choice to define the leaf node attribute that determines space allocation.
This is illustrated in the case of statistics for 50 US states. Let the attributes
be
-
Population
-
Number of Al Gore Votes in 2001 elections
-
Number of George W Bush Votes in 2001 elections
-
Population Density
-
Whether Republican or Democrat won the state
-
Electoral Votes
On initialization the Treemap program allocates equal space to all nodes. Figure
2 shows the initialized Treemap.
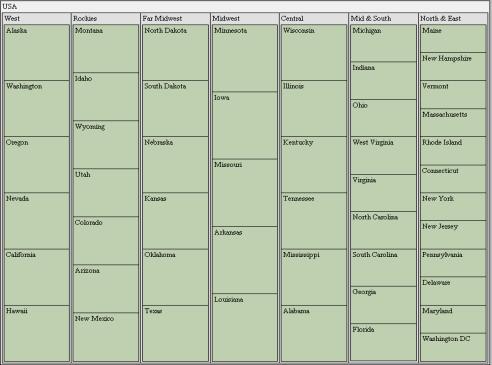
Figure 2: Initialized treemap-'Size by' criteria set to null
so equal space allocation to all nodes.
Now say, the top three densest states need to be known. It can
be done by changing 'size by' attribute to Density

Figure 3: 'Size by' Combo box
The display shows the following picture. Since New Jersey occupies
the largest display area, it's the densest state followed by Rhode Island and
Connecticut. Also Ohio is denser than Virginia but have almost same density
as Florida. This technique also gives insight into the global picture. For example
it can be easily figured out that all of the top 5 densest states lie in the
east coast. Treemap also provides answer to questions like 'Is the densest state
in Mid & South denser than densest state in Central?'
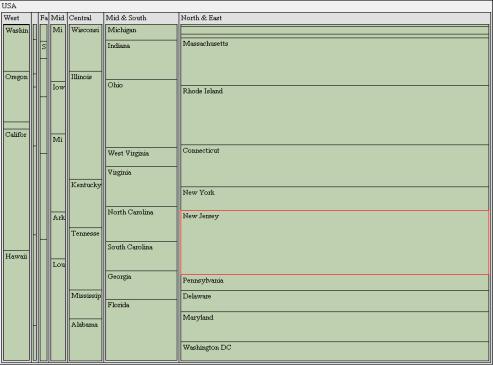
Figure 4: Treemap with 'Size By' criteria changed to Density
Now users' may want to know which states voted Democratic and
which ones voted Republican in the 2000 election. This can be done by setting
'Color By' attribute to 'Party' in the 'Color By' combo box.

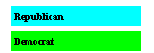
Figure 5: 'Color by' Combo Box and color allocation display
The display changes to one shown in Figure 6.
Figure 6: Treemap with 'Color By' set to 'Party'. Color green
represents Democratic and blue represents Republican.
It can be deduced from the figure that top 5 densest states are
Democratic and most of the states in North and East are Democratic while Mid
and South are mostly Republican. Similarly Sizing by Population and then Coloring
by Party gives the relation between Population and Party. If users' are only
interested in the states by Party it can be easily viewed by setting 'Size by'
to None and 'Color by' to Party. Figure 7 shows this configuration.
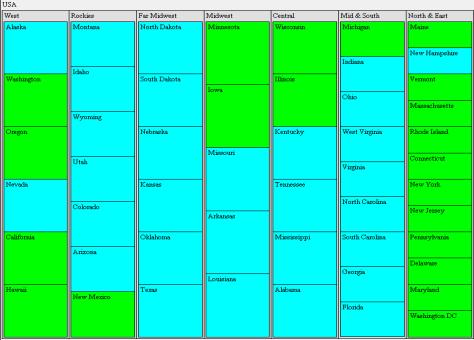
Figure 7: Treemap with 'Size by' set to null and 'Color By'
set to Party. Only shows which state voted for which party.
Treemaps coupled with dynamic query provides users' with powerful
tool to query a large data set or to find patterns. Dynamic query in treemap
is implemented using buttons, radio buttons and sliders. It applies the principles
of direct manipulation to Database searching.
- Visual representation of the query's components
- Visual representation of results
- Rapid, incremental and reversible control of query
- Selection by pointing, not typing
- Immediate and continuous feedback.
Dynamic queries are easy to learn and users can formulate very complex query
with very little training. Lets walk through one example to better understand
the efficacy of Dynamic Query to query a database. Suppose users are interested
in knowing party of the most populous state that satisfies following criteria
- Electoral votes are minimum 12 but not greater than 45.
- Bush votes are minimum
621000 but not greater than 3,800,070
- Gore votes are minimum 37130 but not
greater than 5861200
- Population is minimum 6809200 but not greater than 28700750
- Density is minimum 100 but not greater than 900.
First step is to set all the
sliders to the above values
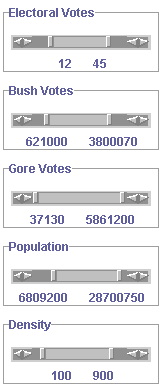
Figure 8: Sliders for dynamic query
As the sliders are adjusted the states that do not satisfy these
criteria are grayed out. Only states that satisfy the above criteria are not
grayed for this example, Illinois, Ohio, Florida, New York and Pennsylvania.
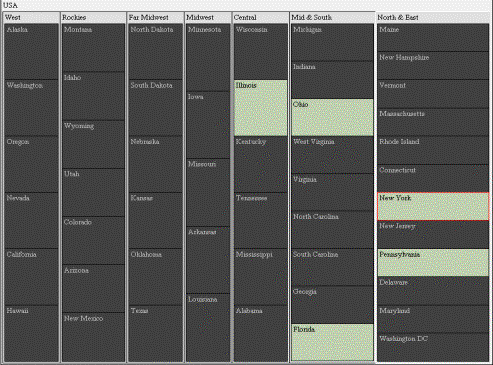
Figure 9: Grayed out treemap when the sliders are adjusted.
Next use the combo box to size by population.

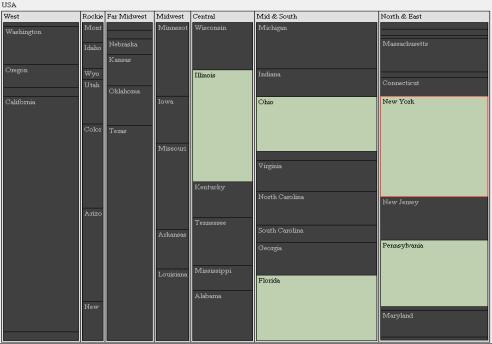
Figure 10: Grayed out treemap when 'Size by' combo box is
changed to Population.
Since New York occupies the largest area among these five remaining
states so NY has the largest population satisfying the above criteria. Finally
to know the party set 'Color by' attribute to 'Party'.

Figure 11: 'Color By' combo box set to party.
Following figure shows the result.
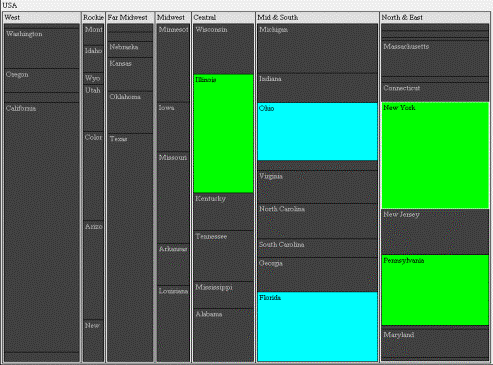
Figure 12: Treemap showing the party of the most populous
state which voted for Democrat and satisfies the criteria set by sliders.
Its clear that New York is the only state that satisfies the above
given criteria and Party it voted for is Democratic.
Refererence
[1] Johnson, B., Shneiderman, B.
Treemaps: a space-filling approach to the visualization of hierarchical information
structures,
CS-TR-2657 , CAR-TR-552, SRC-92-62. [Abstract]
[Postscript]
Year : 1991
Page maintained by Ketan
Babaria (kbabaria@glue.umd.edu)
©2001, HCIL, University of Maryland
Date 03/29/2001
Web Accessibility