Information Visualization
CMSC 838B
Spring 2003
Prof. Ben Bederson
Homework #2
Due February 14th, 2003
Visualize multivariate data
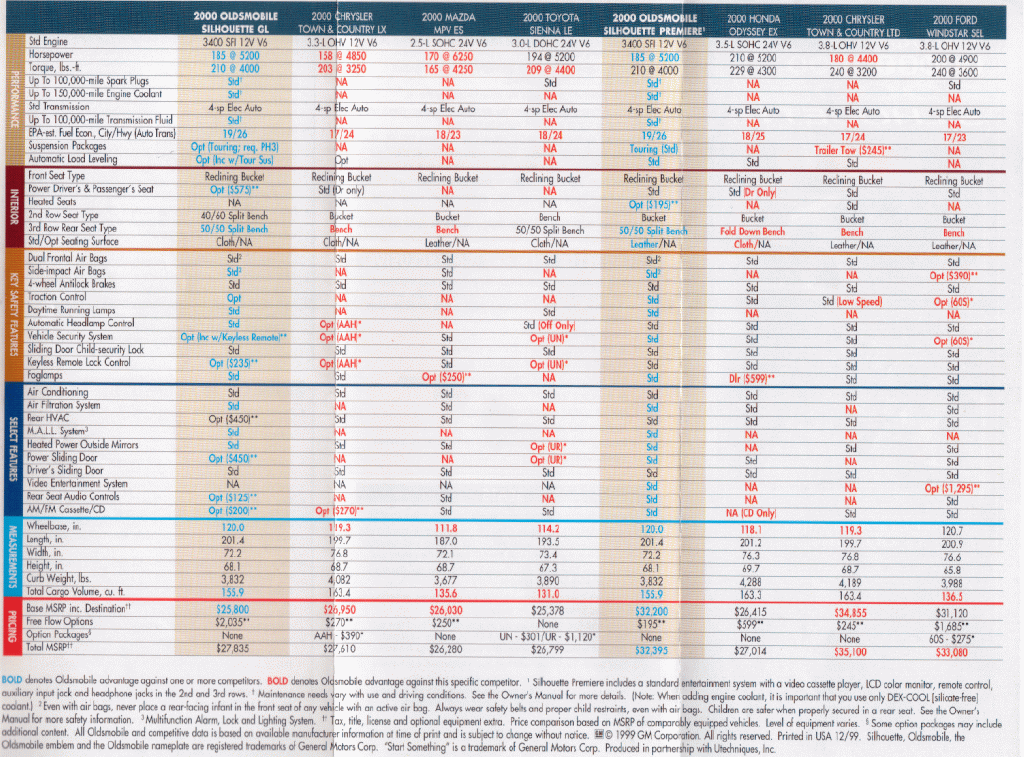
The purpose of this assignment is to get you thinking about how one might visualize a modest multivariate data set. Below is a picture of a data set about minivans. This is really just a data table. As the first part of the assignment, think about the cognitive tasks that people would perform with the aid of this data. What would a person want to know about this data set? Next, I want you to create a visualization of this data that would assist those tasks. Your visualization should be static, simply draw it on paper (you can use computer drawing tools if you want). Look at the current commercial auto website www.cars.com to see what tasks are supported there. Are there tasks that they do not support that visualization might help with?
What to turn in:
Grading: I will evaluate the utility of your visualization to assist with the tasks that you identified. One component of the evaluation will the creativity of your design. Another evaluation dimension is the clarity of your explanations and your critical thinking about the visualization and data set.
This is an individual assignment.
