Network Analysis
This project will require you to use all the techniques we have covered in class so far.Download this adjacency list. It represents a sample of the Enron email dataset. You can open this file by going to the File menu in gephi, selecting open, and then selecting this file.
Your goal is to write a 1500-2000 word paper about this network. Describe interesting features, important people, relationships, etc. This is not something you can do just by looking at the structure - you will need to analyze content as well. That means researching who these people are, what role they played in the organization, and what interactions they had. Your visualization is not part of those 2 pages.
You should provide a deep investigation into this network. Who are the central people? What is their role in the organization? How do you know that? What is their role in the network (e.g. what kind of messages are they sending? to whom?) What are the big clusters? What does each represent? How did you find that out? What kinds of relationships exist? Are there strong personal relationships? Can you identify that by searching for important indicators in the email? What are the most important/strongest relationships? Are those determined by the number of interactions? By the strength shown in the content?
Do not just describe one or two people. I want a thorough analysis of all the major features of the network. Connect that analysis to the content. I want to know much more than just structural features. Explain why people have their roles. Probe deeper to tell me what is going on. Become an expert in this network. If I were to ask "What's up with this node in the blue cluster?" you should know what the blue cluster is, who the major nodes are, what that cluster talks about, and then know how to get to the specific node I asked about and identify who it knows and talks to and what about. Clearly, you can't put deep details about every node in the network, but you should have a deep understanding of what is going on in the network as a whole.
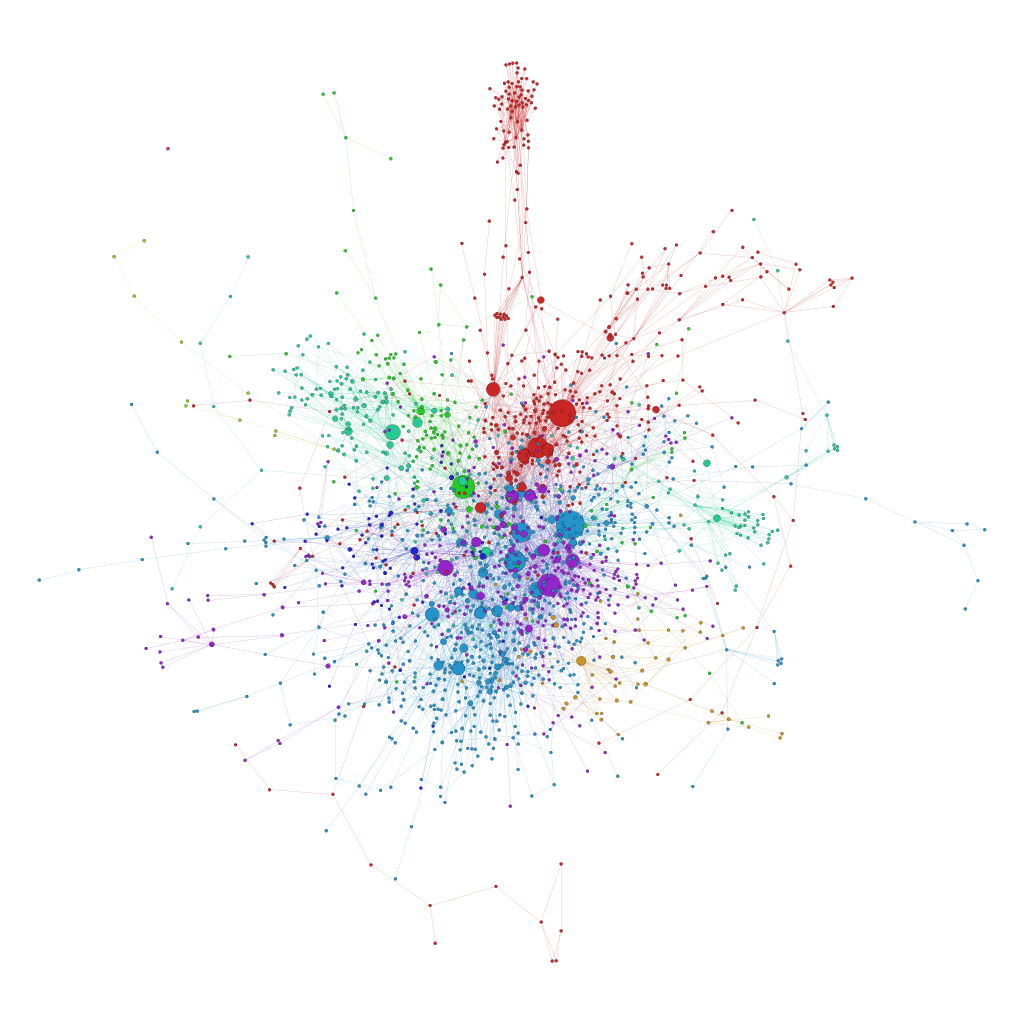
Creating a good visualization will be important. You should filter the network, but not too much (e.g. selecting the giant component and filtering out nodes with a degree of 1 is likely enough - don't get the network much smaller than that). You might also use filters to help your analysis (e.g. filter out people of low centrality so you can focus on learning more about the people with high centrality) but not show those visualizations. You must include at least one good and meaningful visualization in your paper. Here is one that I created that I think could be useful:
It is important in your paper to be analytical rather than descriptive. You should not simply describe what the network looks like or what the structural characteristics are of specific nodes. Instead, give a meaningful description of who people are, what their role is in the network, and how their emailing activities relate to that role.
Examples of things that are poor analysis: "Betty is important because she has a high betweenness centrality." While Betty may have a high betweenness centrality, it does not necessarily indicate she is important. How do you know she is important? Who does she communicate with? Does she connect important or otherwise disconnected groups of people (e.g. different divisions of the organization). Betweenness means something - it reflects a person's role as a gatekeeper or passer of information. Give examples of how Betty has assumed this role.
Similarly, if you find yourself telling me anything about Ken Lay, you are probably on the wrong track. While he is prominent in Enron, he is not prominent in the network. Your task here is to analyze the network you were given and what is in it, NOT to tell me about Enron the organization and how that appears in the network you have.
Part of the purpose of this homework is for you to experience what it is like to do real network analysis out in the wild. That means everything is not as nicely packaged as we might want. You will be working with exactly what is available to anyone else using this data.
To get to the content, you will need to read messages from the Enron collection. You can use a searchable database here: http://www.enkive.org/demo. Please follow the instructions on their page to connect and search. Note that we are relying on another service here and, as with doing real network analysis, it may fail! The raw data is browsable online at http://www.enron-mail.com/email/. The names there are folders for different email owners. You can browse through folders and get to actual messages.
You are also welcome to download the raw data at http://www.cs.cmu.edu/~enron/. It's messy and big, but the files are plain text that you can open in any text editor (TextWrangler is my personal favorite).
Also, feel free to explore other information about the Enron crisis online. If you're up for it, watch the excellent documentary "The Smartest Guys In the Room". (Last I checked, it's available on Netflix). Your goal is to really understand this organization so you can analyze their network.
HOWEVER, remember you are analyzing the network I have given you, NOT the organizaiton as a whole. This is a sample of the network, and the data is weird. It's email. Some people keep everything and other people delete things. Some people may be poorly represented in the sample for many reasons. Thus, people who are important to the organization will not necessarily be the most prominent people in the network you have. Knowing the background of Enron will help you understand who people are and what events are taking place, but you should not simply transfer that knowledge to try to understand the network. The network might look very different.
In your analysis, I would like to see the following concepts discussed:
- Centrality
- Tie strength (e.g. how do the number of messages exchanged relate to tie strength - use the measures we discussed in class to quantify this)
- Clusters, cliques, communities. You absolutely should discuss the communities and what each represents within the organization.
- Density
- Egocentric networks
Grading
60% - Quality of Analysis20% - Quality of Writing
10% - Quality of Visualization
10% - Length of paper and analysis elements present
Because this is a big project, this paper will be weighted as two homework assignments.