
Graphing the Metrics
After computing a network's metrics, the user
can graph the time evolution of the network's metrics. The metrics are:
 Average buffer occupancy
in packets at time t for a link direction ( AvgSize(t) )
Average buffer occupancy
in packets at time t for a link direction ( AvgSize(t) )
Utilization at time
t for a link direction ( Util(t) )
Loss probability for
a link direction ( LossProb(t) )
Achieved throughput
for a traffic class ( Throughput(t) )
To Create a Graph
Recall that the evaluation procedure saves the time-evolution of the metrics
in a dump file specified by the user. To create a graph of the time evolution
of metrics, choose the Create Graphic command from the View
menu. A graph creation dialog will appear.
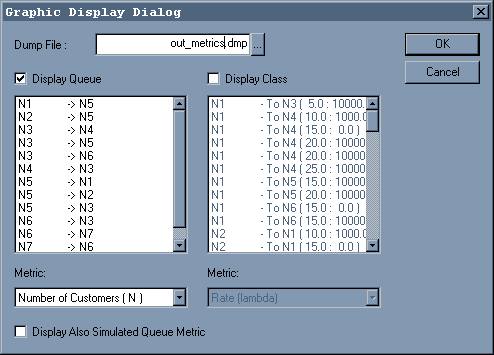
Enter the file where the evaluator dumped the metrics (this would be
the dump file chosen by the user when computing the metrics). Enter the
metrics to be graphed, by first selecting the link metrics option or the
traffic-class metrics option, and then selecting the queues / traffic classes
and metrics. For the average buffer occupancy metric, the program can also
plot the results obtained by running ns.