Affiliation: University of Maryland, Computer Science Department
Overview
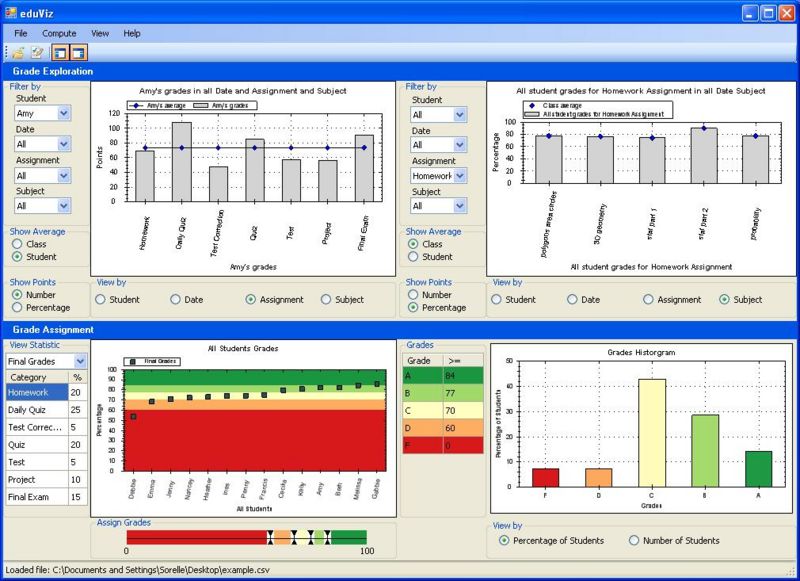 The main screen is divided into a Grade Exploration panel on the top and a Grade Assignment panel at the bottom. The purpose of the Grade Exploration panel is to allow a user to explore their dataset, discover any patterns or anomalies, as well as confirm any speculation the user has about how a particular student is performing. The Grade Exploration panel consists of two identical plots areas which serve to provide the user with an overview of the dataset. Each plot area allows a user to select a different subset of the dataset to view.
The grade assignment panel allows a user to assign grades. The Grade Assignment panel consists of two plot areas - a scatterplot and a histogram. The scatterplot is based on a derived statistic while the histogram shows the number or the percentage of students that fall in each grade category. A unique partition slider is used to change grade ranges dynamically - these updates are simultaneously reflected in the scatterplot and histogram.
Help Videos
| Title | |
| Loading Grade Data | Video: Shows how to open files in eduViz. [00:36] We begin by choosing a spreadsheet of grades to open. We choose "file," "open file," and then navigate to our .csv spreadsheet. When we choose "open," an initial view of the data appears in the top portion of the screen. We will begin by just looking at the grade exploration section, so we expand this section by choosing view and unclicking grade assignment. We can also toggle this view with the icons on the menu bar. |
| Grade Exploration | Video: Shows how to filter grades in the exploration panel. [01:12] To explore grades after a file is loaded and we have expanded the grade exploration section, we begin by filtering the data in the spreadsheet so we only see what we want to examine. This is done by choosing the data to include in the drop down choices in the upper left corner. The default view is to see all the grades for all students in all categories. We click on the student drop down menu and choose "Amy" to see only Amy's grades. Now the graph shows the percentage of points Amy has earned as compared to the class average. Notice that when we mouse over the graph we can see the exact number of points. To see Amy's grades for homework, we choose homework from the assignment drop down menu. Now the graph shows the percentage of points Amy has earned in homework as compared to the class average. To see what this percentage is in terms of raw points, click the radio button that says "number" in the show points section. |
| Advanced Grade Exploration | Video: shows how to use the view by options in the exploration panel. [00:47] After we have filtered the data to include only the grades that we wish to see (in this case Amy's homework grades), we can also change the way we view this data. The "view by" options decide how the information is grouped along the x-axis. Currently we are viewing by student and the only student is Amy, so we see only one bar. If we change this option to view by subject, then we see one bar for Amy's grades in each subject covered in the homework. We can compare this to the class's average. We can also click the "student" radio button in the show average section to show Amy's homework average across all subjects. |
| Creating Grade Assignment Statistics | Video: shows how to use create a new statistic to determine total grades. [01:32] After exploring student scores, we may wish to concentrate on assigning grades. First, if we have removed the grade assignment view, we choose view and then click "grade assignment" to get this panel back. In order to assign grades, we need to decide what scores the totals will be decided based on. We do this by choosing "compute" and then "new statistic". We name our new statistic and then choose the category to compute it based on. We decide to assign grades based on assignments. We then enter the percentage we want each assignment to be worth. For this example, we will make all assignments worth zero percent except for the final which will be 100 percent. We can click through the cells or use tab. When we are done filling in the percentage choices for this statistic, we click ok and see the student grades appear sorted in the grade assignment panel. |
| Assigning Grades | Video: Shows how to assign grades in eduViz. [00:37] Once we have created a statistic, we can assign grades. To assign grades, move the markers on the partition slider. Notice that the band of color representing the grade range on the scatterplot, the numerical grade in the table to its right, and the histogram representing the number of students earning each grade all change as you move the markers on the partition slider. The histogram can be displayed by percentage or by number of students. To change the display to number of students, click the radio button that says "number of students." |
| Advanced Features | Video: Shows additional picture options (save, zoom, etc). [00:50] Each figure in eduViz has some additional options that are not immediately visible. Mouse over one of the figures and right click to see a list of these options. We could easily save these figures as pictures. We can also zoom into the picture. Use your mouse to create a rectangle over a part of the picture that you want to zoom in on by clicking and and dragging the mouse before releasing. To unzoom, right click on the picture and choose "unzoom" from the menu that appears. |