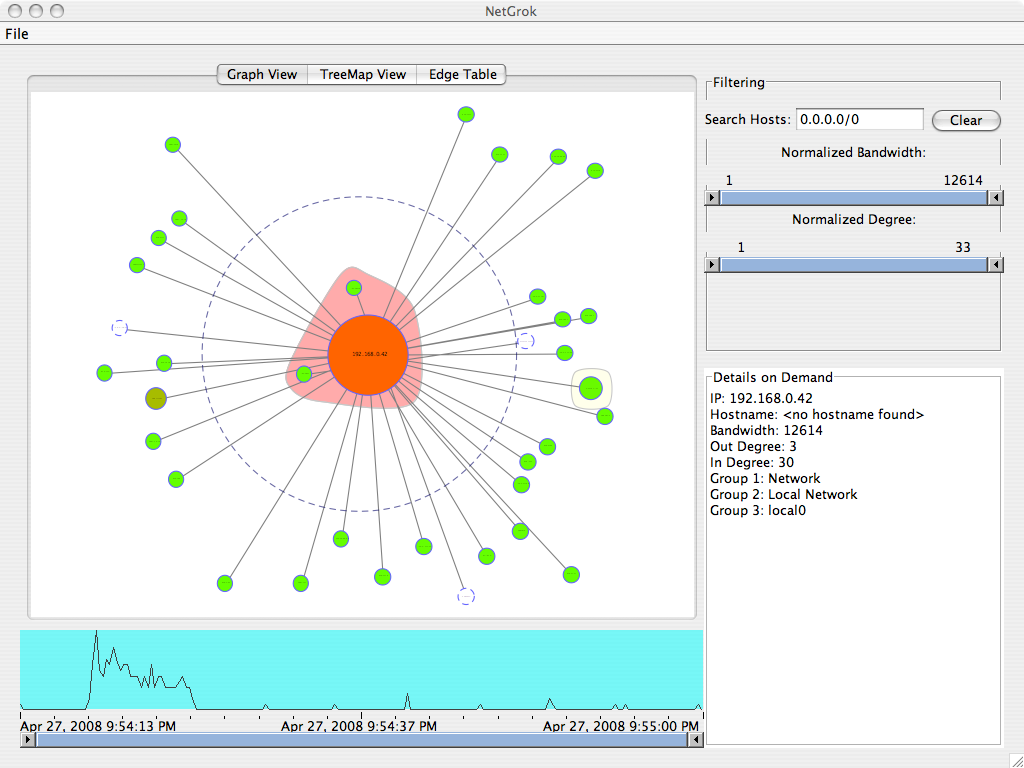
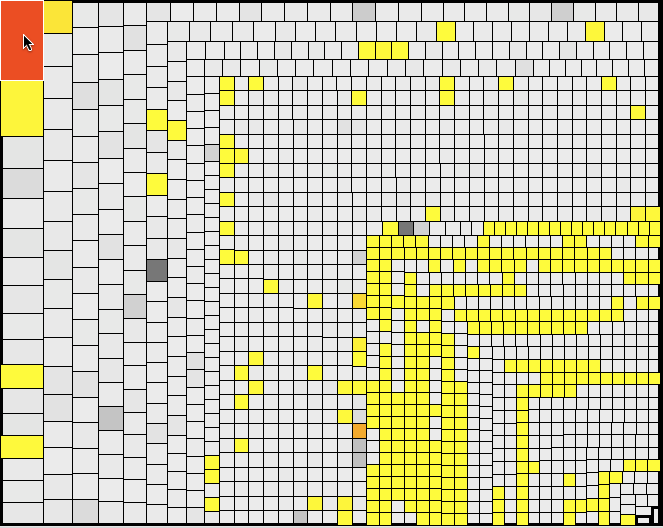
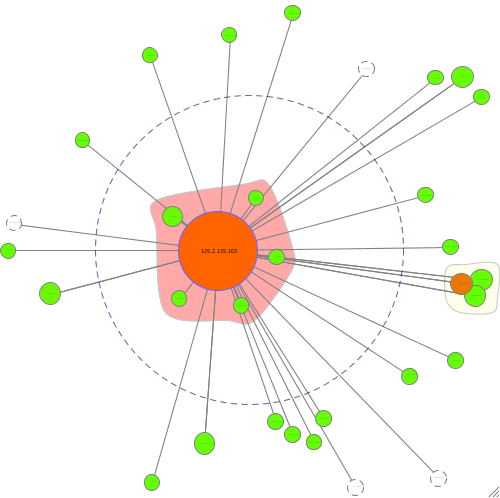
Latest NewsNew! March 2010. NetGrok demoed at RSA 2010: McRee, R. Visualizing IDS Output: Tools and Methodology. RSA, 2010. (pdf). New! March 2010. NetGrok used to analyze Zeus botnet activity. McRee, R. NetGrok and AfterGlow: Visualizing the Zeus attack against government and military. Information Systems Security Association Journal, 2010, 8, 40-32. (pdf). August 2009. NetGrok was featured in a cover story on security visualization for the September 2009 issue of Linux Magazine (pdf). AbstractWe present NetGrok, a new tool for visualizing computer networks in real-time. NetGrok applies well-known information visualization techniques (overview, zoom & filter, details on demand) and employs a group-based graph layout and a treemap to visually organize network data. NetGrok also integrates these tools with a shared data store that can read PCAP formatted network captures, capture traces from a live interface, and filter the data set dynamically by bandwidth, number of connections, and time. We performed a user case study that demonstrates the benefits of applying these techniques to static and real-time streaming packet data. Specifically, NetGrok serves as an "excellent real-time diagnostic," enabling fast understanding of network traffic and easy problem detection. |
|
ScreencastDownload hi-res (m4v - try VLC) |
CreditsNetGrok was built for the Spring 2008 Information Visualization course taught by Ben Shneiderman at the University of Maryland, College Park. See the class wiki for more information. |
Participants
|
|
PublicationsBlue, R., Dunne, C., Fuchs, A., King, K., & Schulman, A., Visualizing Real-Time Network Resource Usage, In Visualization for Computer Security, Goodall, J.R. and Conti, G. (Editors), Springer-Verlag Berlin / Heidelberg (2008), 119-135. See at SpringerLink or download the pdf |
VizSEC 2008 PresentationFiles from our presentation at VizSec 2008
|
Screenshots |
|
|
|
| Showing links by hovering over a host in the treemap. | NetGrok's network graph visualization. |
SourceHead over to our site on Google Code to download an executable jar or browse the source codes. |
|