About wireless trace fidelity
Packet traces from 802.11 wireless networks are incomplete both fundamentally---because antennas do not pick up every transmission everywhere---and practically---because the hardware and software of collection may be under provisioned. We propose methods to evaluate the fidelity of merged and independent wireless network traces.
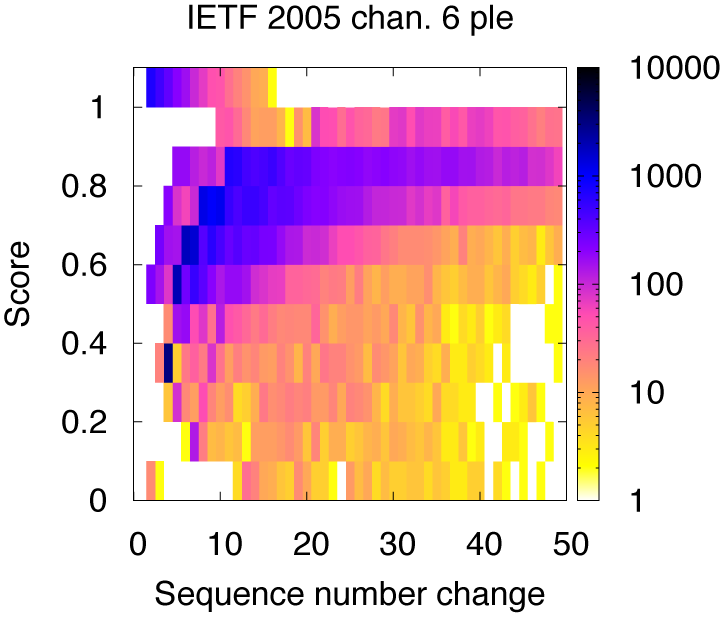
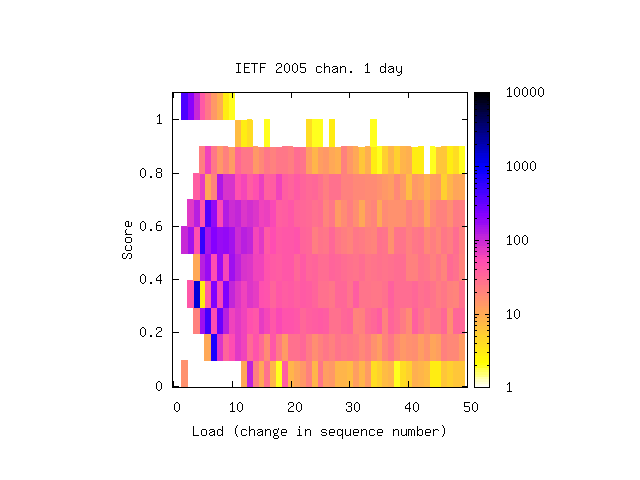
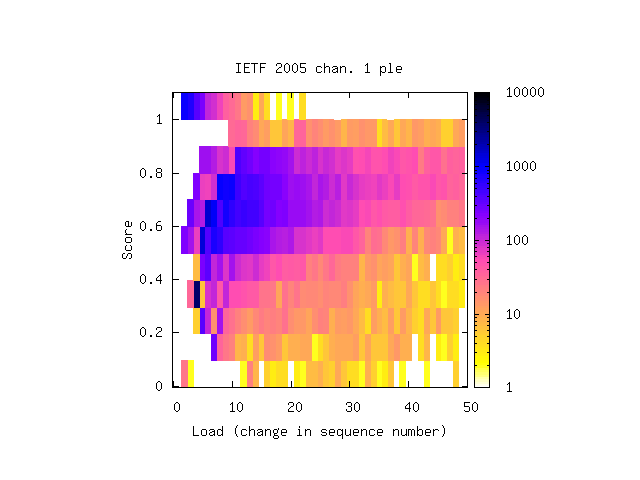
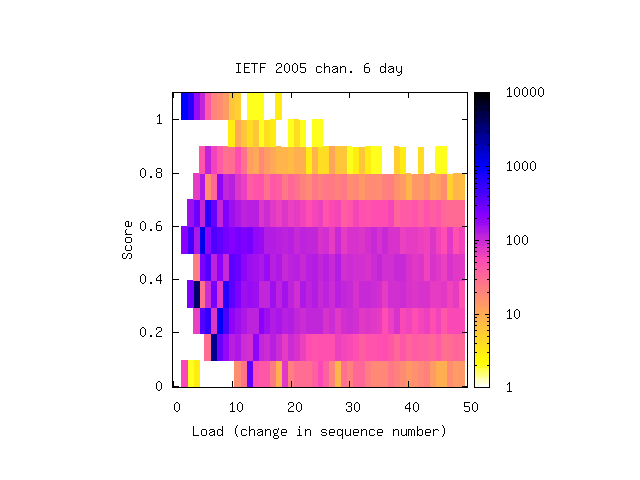
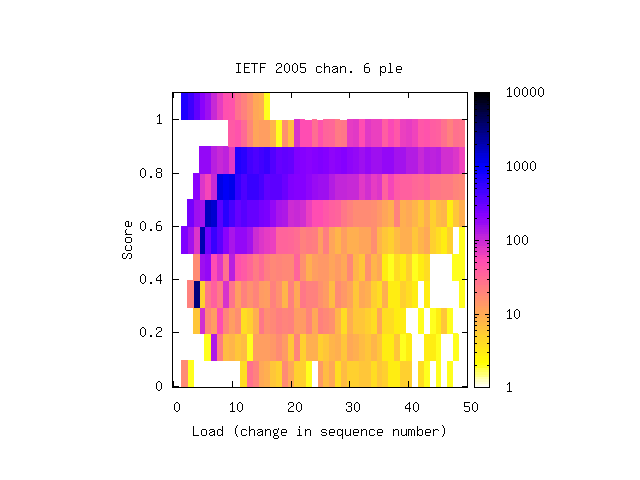
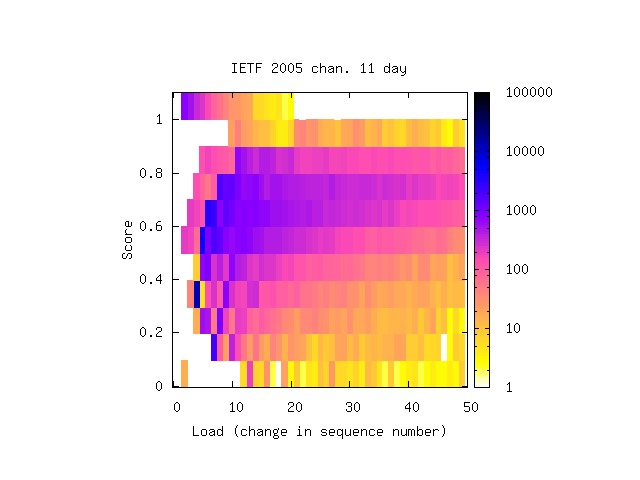
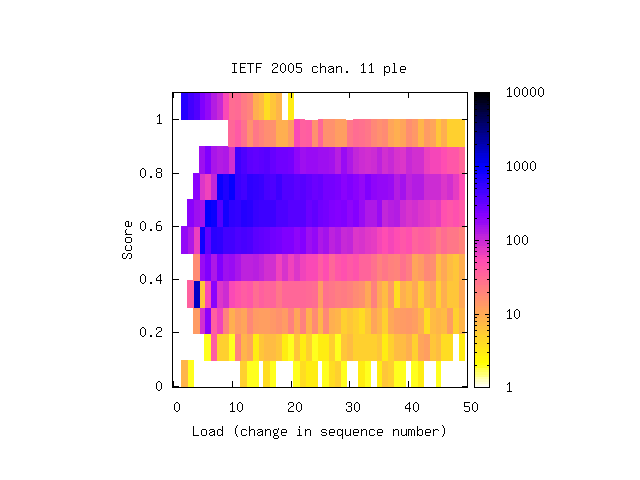
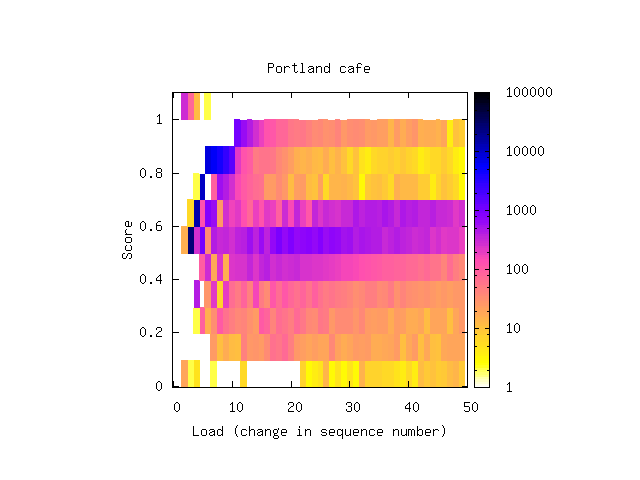
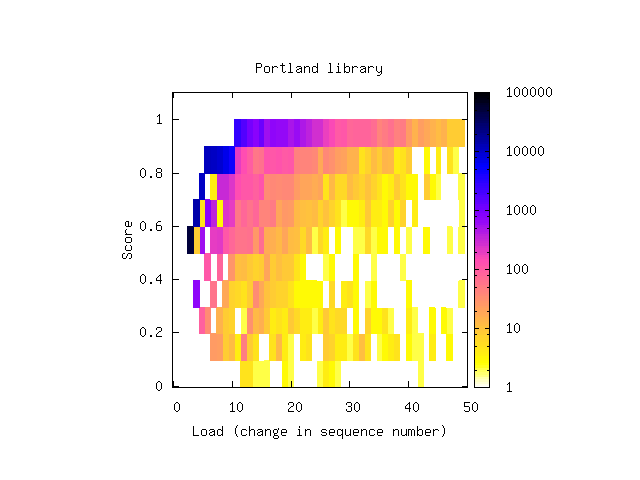
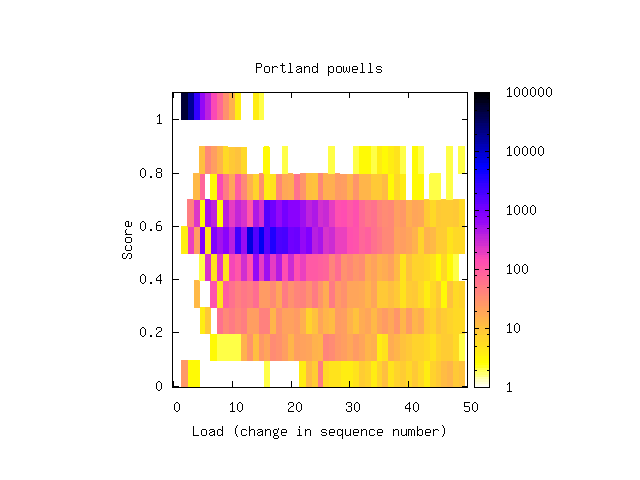
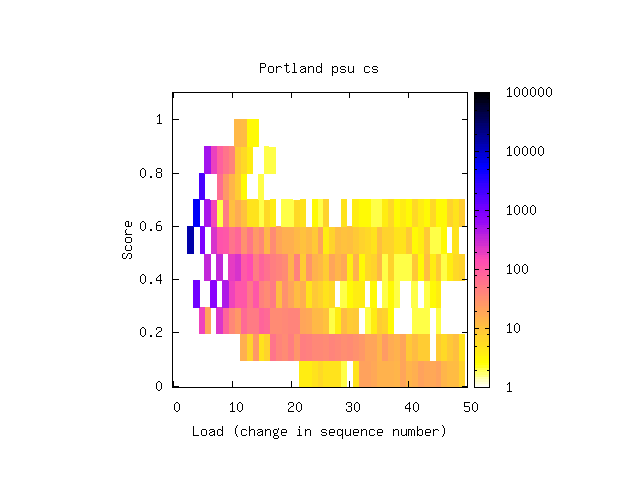
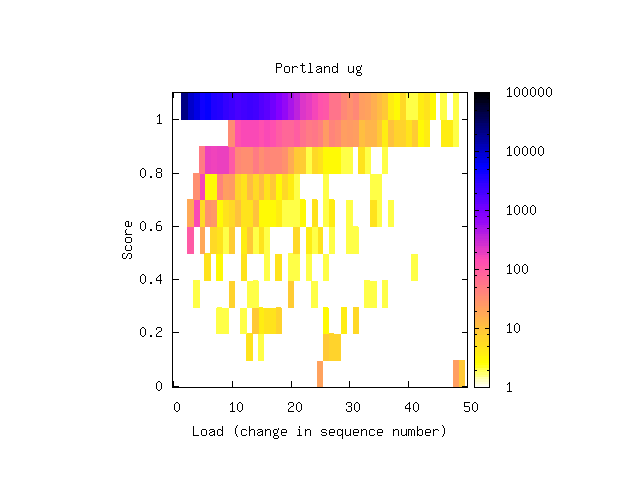
One of our tools is the T-Fi plot, pictured to the right. This visualization is a colormap in which:
- The orientation on the y-axis shows completeness, that is, the fraction of transmitted packets caught by the monitor.
- The width of the shaded region on the x-axis shows the range of load.
- The intensity of the shaded region shows the frequency of load.
Wireless traces from SIGCOMM 2008 are available.
Data
Data from our wireless trace at SIGCOMM 2008 will be available by mid-February. Stay tuned.All of the data we have used to date was originally obtained from the CRAWDAD wireless trace repository. We direct the reader to that site to obtain the traces we used (Portalnd PDX, IETF 2005, and SIGCOMM 2004).
Please feel free to run this on other traces and share your results.
Download
Note: Timing statistics require perl built with 64 bit support. See README.
Note: Version 0.04 had a broken score formula in Stats.pm. Please recompute all version 0.04 score plots with the latest version. Thanks to Dan Halperin for finding this bug.
T-Fi Plots
Click thumbnail for the full-size plot.IETF 2005
| chan1-03-09 | chan1-03-10 | chan6-03-09 | chan6-03-10 |
|---|---|---|---|
|
|
|
|
| chan11-03-09 | chan11-03-10 | ||
|
|
Portland PDX
| cafe | library | powells | psu_cs |
|---|---|---|---|
|
|
|
|
| ug | |||
|
Papers
On the Fidelity of 802.11 Packet TracesAaron Schulman, Dave Levin, and Neil Spring
PAM 2008 (Passive and Active Measurement Conference)
People