|
Basics Everything on the
screen is graphics. Toolkits, like Java Swing and the .NET
Windows Forms library provide ready-made standard widgets, like
scrollbars and buttons, that you can add to your GUI.
But, if you want to create a custom component, you have to do
your own drawing!
Drawing Abstraction Every computer
graphics system (i.e., operating system) offers some notion of a
canvas to draw onto. Usually, the canvases are separated into
windows that are distinct from each other, which provide a relative
coordinate system and isolation. This abstraction allows the same
binary-level application to render onto different kinds of surfaces
such as screens, off-screen buffers (i.e., clipboards), and
printers, plotters, and direct neural implants... Most current
systems offer a a resolution-independent (or device-independent)
API. This is crucial. If all rendering was done in pixels, a 100
pixel rectangle would be about an inch big on most displays, but
would be less than 1/10th of an inch big on some printers. Java
offers the Graphics/Graphics2D classes that present this
abstraction, and C# offers the System.Drawing.Graphics class.
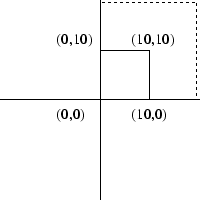
Coordinates
Device coordinates - Coordinates of the physical
device:
- Usually has origin (0, 0) at upper left
- X increases to the right
- Y increases down
- Integral coordinates always has X in [0, width] and Y in
[0, height]
- Coordinates correspond to pixels
- Need to know pixel density (DPI - dots per inch) to create a
specific-sized object
Window coordinates - Coordinates within an operating system
window
- Similar to device coordinates
- Can have out of bounds coordinates which are clipped
by the OS
- If there is a frame around the window ("window
dressing"), that is outside the dimensions of the
window
Physical coordinates ("device-independent coordinates") -
correspond to physical measurements
- Defined in universal measurements - inches,
millimeters, points (1/72 of an inch)
- Necessary to make graphics the same size independent
of device
Model ("local") coordinates - correspond to the
object you are defining
- You may want to define an application-specific coordinate
system
(i.e. Origin at the center of screen with one "unit" per
inch)
- Need to convert between coordinate systems
Transformations
- A "transform" object encapsulates a coordinate system
- A sequence of transforms can efficiently switch coordinate
systems
Graphics Description Models Stroke Model -
describes images with strokes of specified color and thickness.
There are also several other parameters, such as how the line
segments are connected, and whether the line is drawn solid, or with
dashes. In addition, strokes can be anti-aliased.
Line from (4,5) to (9,7) in red with a thickness of 5
Circle centered at (19,8) in blue with a radius of 8 and a thickness of 3
...
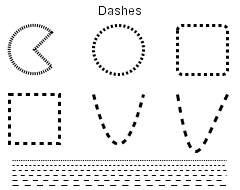
Dash Styles |

End
Cap Styles |
Unantialiased Line |
 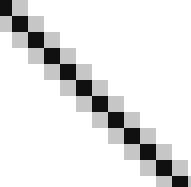
Antialiased Line |
Region Model - describes images with filled areas such as
arcs, text, splines, and other shapes - often other stroke objects.
The area may be filled with a color, or a more complex fill such as
a gradient or texture (known as a paint in Java or a Brush
in C#).
Polygon filling (0, 0)-(10, 5)-(5, 10) with yellow
...

Solid Fill |
Gradient Fill |
Pixel Model - describes images as a discrete number of
pixels. Each pixel is specified by a color from one of several
possible color models.
NOTE: In practice, graphics are
described with a combination of stroke, region, and pixel
descriptions.
Drawing Shapes
Java has a generic Shape
class with g2.draw() and g2.fill() methods. See
java.awt.geom. Including GeneralPath which connects
points with lines or curves. It can be rendered
resolution-independent, or can be flattened with
FlatteningPathIterator
C# has fixed shapes rather than a generic Shape class.
See Graphics.DrawEllipse, DrawBezier, DrawCurve, etc. C#
also has a generic path called Drawing2D.GraphicsPath,
rendered with Graphics.DrawPath.
Rendering Damage/Redraw In most graphics systems, you
override a window's paint method and put all your rendering code
there, but you don't actually call that method directly.
Instead you will request a render by telling the OS that a portion
of the screen is "damaged." It is out of date and needs to be
repainted. The OS will collect and merge all the damaged
regions and at some point later it will call the window's paint
method passing it the full region that needs to be repainted.In
java, you can request that a window be rendered with JComponent.repaint().
In C#, you would use Control.Invalidate. Or, you could just
damage a portion of the canvas with repaint(x, y, w, h) in Java or Invalidate(Rectangle)
in C#. Remember that these methods only
request repaints to happen in the future, they do not happen
immediately.
Text Text is a special kind of graphics
for both performance and human reasons. Characters in
any font can be represented either as bitmaps or curves.In some
systems, characters are defined as the set of pixels (bitmap) that
form each character. This approach is efficient since we need
the set of pixels that make up the characters in order to draw them.
But, for large font sizes the space required to store all the
bitmaps becomes problematic.
Another approach is to store only the outlines of the characters
as closed shapes. These character definitions can easily be
scaled to any size and converted to bitmaps when necessary.
Plus, drawing packages can treat characters as geometric shapes that
can be manipulated like other graphical elements.
Typically you will allocate fonts up front, and then use them on
demand. See the Font classes in Java and C#. Fonts get measured with Ascent, Descent, Height, Leading,
Width, and Kerning. Higher quality text can be drawn with anti-aliasing or
more recently, sub-pixel anti-aliasing (e.g., Microsoft
Cleartype)
Color
There are various color models, which are not reflected in the
API. Rather the API needs to support the color representation
of the hardware. There are two basic kinds, Indexed Color (8 bit) and True Color (16, 24, 32 bit).
Indexed color uses an array of color values as a palette.
An index into the color table is assigned to each pixel. Using 8
bits per pixel allows only 256 colors.
Models that can represent a large number of colors are called
true color. Examples are RGB, HSV, and CMYK. The common 8-bit RGB model assigns a 3 byte value to each pixel, one byte per channel
(red, green and blue). This model can represent up to 28
× 28
× 28 or
16,777,216 colors.
Clipping Clipping, or limiting drawing to a particular
area of the screen, is crucial for a window
manager. Displayed objects need to be clipped to the
bounds of the window in which they are displayed. But,
clipping is also necessary for application efficiency and high-end
graphics.Regions, analytical descriptions of shape, are used for
the basis of clipping. Regions include algebra for
adding/subtracting, manipulating shape and there are various types
(rectangular, rectilinear, rectilinear with holes).

Java has the Area class (made of Shapes) and C# has the Region
class.
Efficiency There are various efficiency
considerations that must be made when working with 2D computer
graphics. Some common mechanisms/considerations include region management (partial
redraws), high-level descriptions for networked displays, display lists for complex objects that are redrawn many
times, space-time trade-offs (i.e. pre-allocate thumb image
and store it, or render it each time).
Geometric Equations
In a drawing
program, there are some common problems such as determining what
object a user clicked on, finding the nearest
object to where the user clicked, or snapping a line to the nearest object.
It turns out we can use a few simple geometric equations to aid with
these tasks. And, there are different forms of these equations
for different uses.
Implicit Forms: F(x, y) = 0
i.e.: Ax + By + c = 0
This type of equation defines a half-space. And,
intersecting multiple half-spaces defines polygons. So, this
kind of equation can be used to
determining if a point is within a region or finding the distance
from a line.
Explicit Forms: y = F(x)
i.e. y = Mx + BExplicit functions are not good for
graphics operations, since they don't plug a point in.
Parametric Forms: x = G(t), y = H(t)
i.e.: x = cos(t), y = sin(t)
or,
x = x1 + t * (x2 - x1)
y = y1 + t * (y2 - y1)
Here, both x and y are functions of an independent variable.
If you plug in some value for t, you can plot a point on the line.
The functions x(t) and y(t) vary along the line, as t varies so you
can interpolate along a line.
More generally, this is known in the computer graphics
world as LERP (linear interpolation):
p = p1 + t * (p2 - p1)
The LERP equation bounds t between 0 and 1. It directly
supports animation, computing intersections, scales to multiple
dimensions and can be applied to many domains (points, colors,
etc.).
Control Points: Used to specify geometry - often
accessed through "handles" in an interface
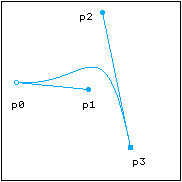
Cubic Bezier Curve |
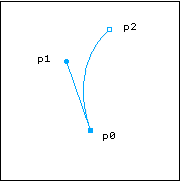
Quad Bezier Curve |
Geometric Transformations
Often an application will need to translate (move), scale,
rotate, or shear it's graphical elements. This is necessary
for almost any animation and many interactions. One way to achieve this
would be to modify all of the points in the original object.
For example, in a game of asteroids, to move the triangular ship
down ten units, you could add 10 to each point in the triangle. The
problem with this approach is that it forces you to modify your
original object. You will no longer have a copy of the original to revert back to. And for
some transformations, it's worse. What if you scale all the
points by zero? Then you've lost your data altogether. A better
approach would be to save your original object and somehow transform
it when you render. This is commonly done in computer graphics
with matrices.
Matrix Transformations
We can represent some transformations as 2x2 matrices of the
following form.

We
can then multiply the matrix by a column vector to apply the
transformation to a point.
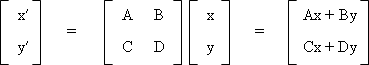
x′ = Ax
+ By
y′ =
Cx + Dy
Matrices also allow as to represent a sequence of transformations.
Multiplying two matrices of the same size yields another matrix of
the same size. So, the three transformations above can
actually be represented as a single matrix. As long as we can
represent transformations as 2x2 matrices, we can multiple them
together to create one representative matrix.
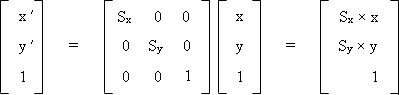
Scaling
One common transformation involves scaling around the origin (0, 0).
Here, we multiply all the x-coordinates by some scale factor Sx and
we multiply the y-coordinates by some scale factor Sy.
 |
x′ = x
× Sx
y′ = y
× Sy |
If we define P as a point [x, y], we can combine
the equations above to get the following representation.
P′ = S
∙ P or,
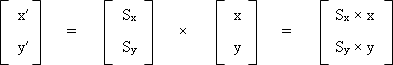
We can then represent the scale vector as 2x2 matrix.

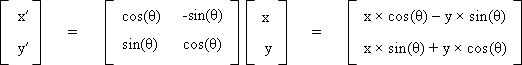
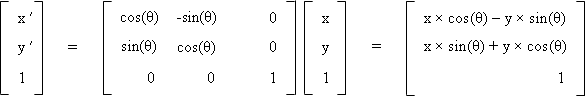
Rotation Another common type of transformation is rotation, where we rotate
the points by some angle θ.
![\includegraphics[width=2.0in]{math-rotate.eps}](images/rotate.gif) |
x′
= x × cos(θ)
- y × sin(θ)
y′ = x
× sin(θ) + y × cos(θ) |
Again, we can represent rotation as a 2x2 matrix. P′ =
R ∙ P or,
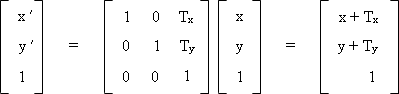
Translation
A simple transformation involves adding some offset Tx to
all the x-coordinates, and adding some offset Ty to all
the y-coordinates. This is known as a translation.
 |
x′ = x + Tx
y′ =
y + Ty |
If we define P as a point [x,
y], we can combine the equations above to get the following
representation:P′ = P +
T or,
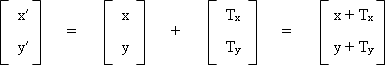
But, we cannot represent translation as a 2x2 matrix! This
means we won't be able to combine it with rotation and scaling
transformations through matrix multiplication. The solution is
to use homogeneous coordinates.
Homogeneous Coordinates
We can take a 2-dimensional point and represent it as a 3-vector.
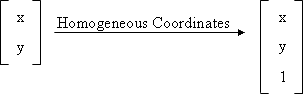
We add a third coordinate h to every 2D point, where (x, y,
h) represents the point at location (x/h, y/h).
We can now represent translation as a 3x3 matrix of the following
form. P′ = T ∙ P or,
We can then change our scale and rotation matrices into 3x3 matrices
as well. P′ =
S ∙ P or,
 P′
= R ∙ P or,
This may not seem intuitive or exciting. But, it is quite useful
for graphics operations because it allows us to combine translation,
scale and rotation transformations, simply by using matrix
multiplication.
Affine Transformations The 3x3 matrix
that we derived above is called an Affine Transform. It can
encapsulate translate, rotate scale, shear and flip transformations.
Affine Transformations have various properties.
- Origin may not map to the (0,0)
- Lines map to lines
- Parallell lines remain parallel
- Ratios are preserved
- Closed under composition
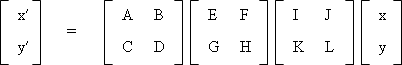
Matrix Composition
As we discussed above, we can multiply various matrices together,
each of which represent a transformation, in order get one general representation. For example, if we scale, rotate and
then translate, we will have done the following.
P′ = ( T ∙
(R ∙ (S ∙ P)))
We can then separate out our matrix.
P′ = ( T
∙ R ∙ S) ∙ P
M = TRS
However, matrix multiplication is not commutative.
M1 ∙ M2 != M2
∙ M1 To
apply a transformation after the current one, we post-multiply the
matrix.P′ =
Mnew ∙
Mcurrent P
To apply a transformation first, we pre-multiply.
P′ =
Mcurrent ∙
Mnew P
Coordinate Systems
Transforms can manipulate objects or views. If we
transform, draw an object, and then transform back, we are
manipulating objects. But, if we set a transform once at the
beginning and then draw the whole model we are manipulating the
view. Actually, we are defining a new coordinate system.
It turns out an affine transform actually defines a coordinate
system. Imagine we apply a rotation, followed by a
translation. We can think of this as creating a rotated,
translated coordinate system, with a new origin.
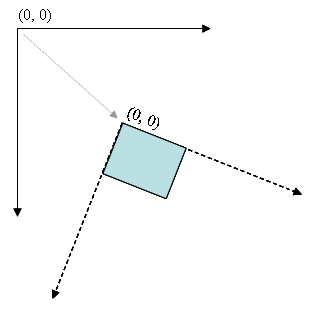
We can now draw objects as normal using the local coordinates
of this new coordinate system. So, if we draw an object a (0,
0), it will appear at the new origin of the new coordinate system.
Thinking of things this way is often simpler than thinking about
transforming individual objects.
What about Piccolo?
For the most part, Piccolo handles doing things efficiently for you.
The framework implements region management (only repainting the part
of the screen that has changed) as well as efficient picking
(determining which object the mouse is over). Piccolo's
activities make it very easy to implement interpolated animations.
And, in many cases, you can use convenience methods to transform
nodes rather than interacting directly with matrices.
Piccolo also has a higher-level model of drawing than the one
described above. Rather than drawing lots of shapes to the
screen in a one large paint method and then worrying about
repainting and picking them, piccolo uses an object-oriented
approach. You simply add nodes to the scene-graph. Each
node knows how to render and pick itself. Instead of
invalidating a rectangle and then drawing in the window's paint
method, you will change the node's model. For example, you may
change its fill color (paint in Java, Brush in C#). Then the
node will handle repainting itself with the new color.
Each node also has an affine transform that defines a local
coordinate system for that node. Nodes can be arranged
hierarchically, where the local coordinate system of a node is
product of all the matrices from the root to the given node.
So, changing a parent node's transform, will affect the child as well. For more details about coordinate systems, see
Piccolo Patterns.
|