Mid-april 1997 (Output of MARCH 1997 meeting - Rich Mushlin and Catherine Plaisant.
PIECES:
Notes:
Orders
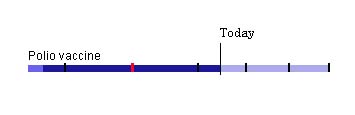
1-Medications
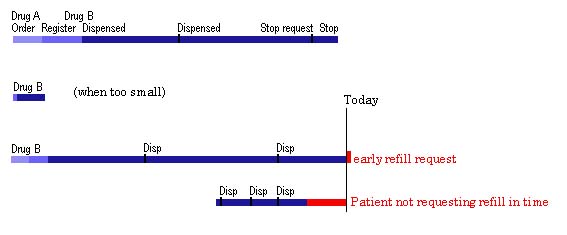
MISSING: show example of aggregation + example where size or color used for dosage
2- Procedures
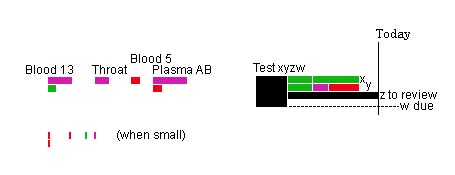
2a - Lab
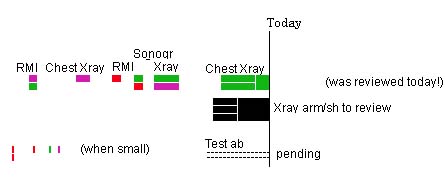
2c - Imaging
2d - Immunizations
2d - Others (e.g. referals)
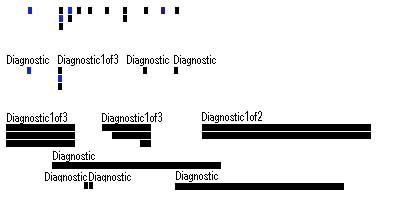
Figure 1: General
The notes are really the gren ticks, the line could be either show a note
covering several visits, or a "period of care" either infered
from the fact that the diagnostic was the same for all the notes on the
line, or indicated by the phyician entering the note as "followup".
History (the 2 pregnancies) is shown twice here to illustrate that it can be put in front of the notes (may be with a different color since this is not hard data but patient provided information?) or in a specificHistory facet at the bottom.
The event list shows all the mos recent events. The status also on the right of the display.
Figure 2: diabetes
User selected the worsening diabete line and focused on it. Only the
event associated with that period of care are now let in the lifeline.
There should a way to make obvious that the display IS filtered. May be
the rest should still be present but grey.
The red tick visible on TODAY for the Insulin has been clicked on highlighting below the details: A refill who has not been requested by the patient yet while overdue.
Figure 3: Pregnancy:
Here zooming on recent events, the pregancy is now prominent, the cursor
has highlighted the last vitamin refill, the event list has been fltered
to show all lab events.
____________________________