Lifelines2: Discovering Temporal Categorical Patterns Across Multiple Records
.
SEE ALSO OUR NEWER WORK on EventFlow
While Lifelines2 only handles point event data (i.e. with a single timestamp) EventFlow now also handles interval data, and provides advanced query capabilities.
Project Description
Electronic health records (EHRs) contain a wealth of information. Categorical event data such as complaints, diagnoses, treatments, etc., are important, and play important roles in health providers decision making. However, past research efforts have been focused on numerical data and single-record visualization techniques. Discovering patterns of categorical events across multiple records are supported in limited ways.
Lifelines2 is an interactive visualization tool for visualizing temporal categorical data across multiple records. The goal of the project is to enable discovery and exploration of patterns across these records to support hypothesis generation, and finding cause-and-effect relationships in a population. These tasks are not specific to the medical domain, but we were first motivated by EHRs.
Features
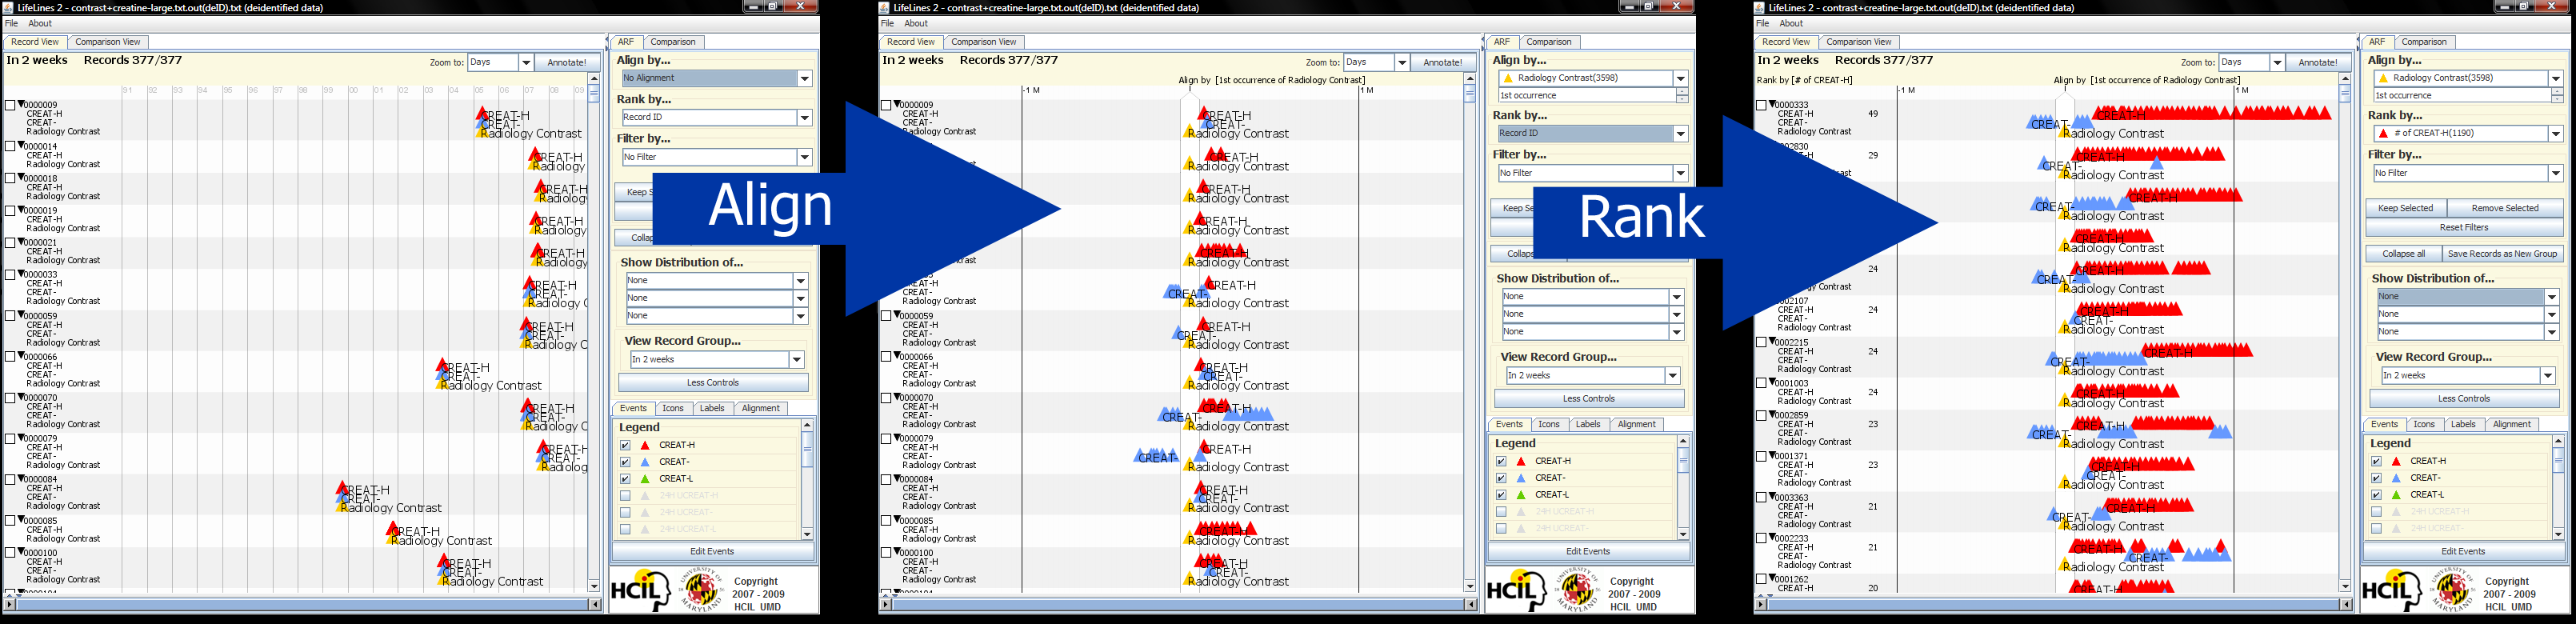
In Lifelines2, we advocate a framework of simple operators to allow users to manipulate multiple records simultaneously to understand relative temporal relationships across records. The three operators are Align, Rank, and Filter, and we affectionately call it the ARF framework. Alignment forces every record to be aligned by a certain feature (e.g. 3rd Heart Attack) so the events that occur prior to and after the feature can be compared easily. Rank and Filter are traditional operators analysts are familiar with, and they augment the Align offers. In addition, analysts can use temporal summaries to view distribution of multiple event types over time. Temporal summaries augment filter by allowing temporal constraints to be specified. Temporal summaries also allow multiple groups of records to be compared.
 |
||
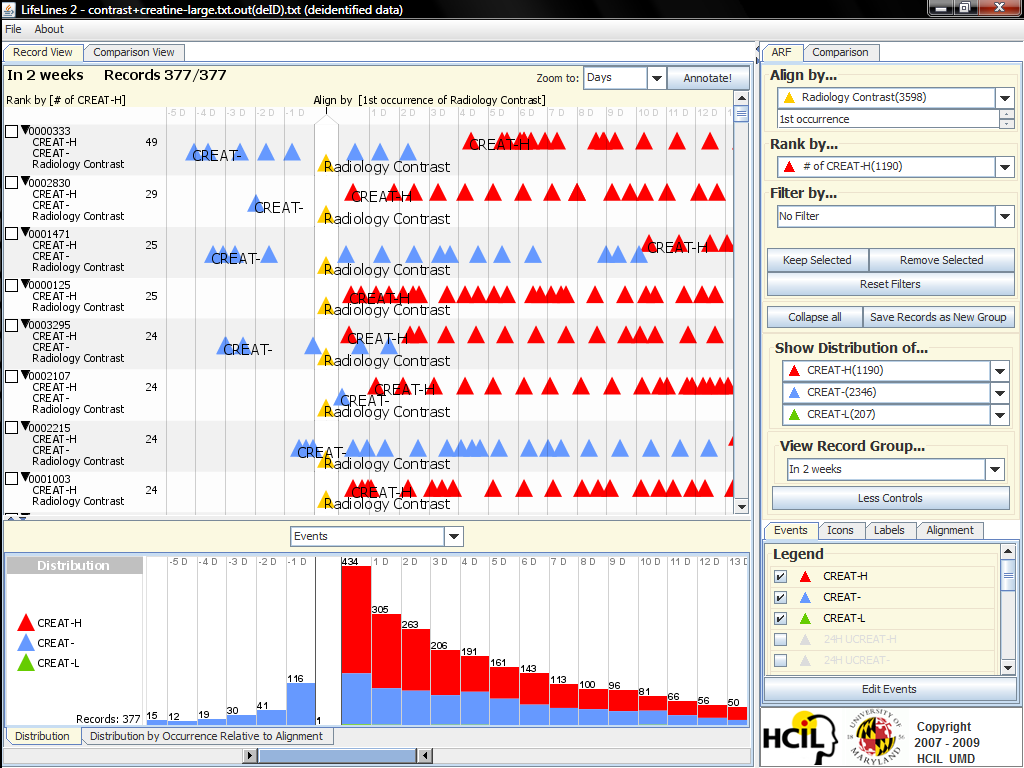
| 1. 377 patient records are shown in the main visualization. These patients had been administered radiology contrast. Physicians are interested in patients that have high creatinine readings within 2 weeks after the administration of contrast. | 2. Every patient's 1st Radiology Contrast event (yellow triangles) is brought on the same vertical line, allowing analysts to view creatinine readings before/after the alignment quickly and perform relative comparisons. | 3. Rank is applied to bring patients with the most number of creatinine high (CREAT-H) readings up top for analyses. |
 |
|
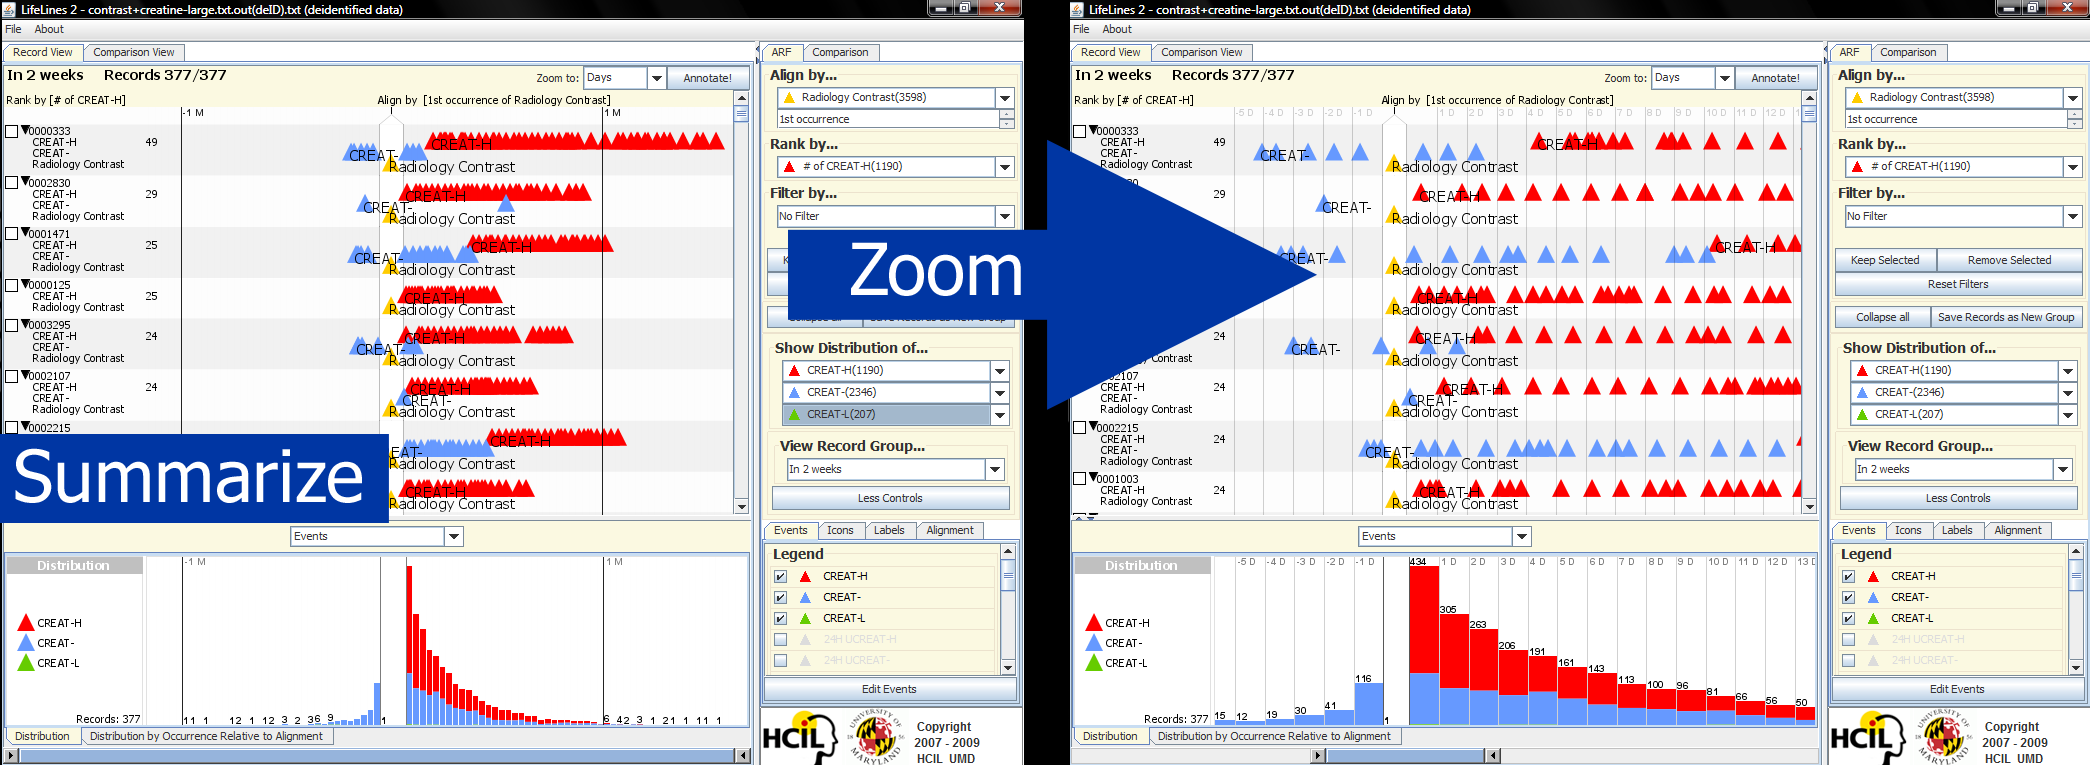
| 4. Temporal summaries can be brought forth to see distribution of multiple events over time. | 5. A final zoom into the timeline allows analysts to examine the events in detail. |
Lifelines2 only handles point event data with a single timestamp - opposed to intervals with a start and end time. Early versions of Lifelines included a way to display an interval of validity for each point event on the timeline (to visually remind users of implicit durations of the events e.g. a blood sugar level is only valid for a very short time, while a vaccine may be valid for several years) but this introduced some confusion as users interpreted those durations as certain, while they were not (see CHI 2008 paper).
See our newer work on EventFlow now works with interval data and all the complexity it introduces...Video Demonstrations
Video |
Description |
.mp4 Format |
|
Medical Scenario:Some small percentage of population (1%-7%) experience reduced renal function after infusion of radiographic contrast material such as iodine-based agents. To monitor patients' renal status, serum creatinine value in blood is tested. High creatinine readings indicates reduction in renal function.
Demo Summary:This demonstration shows how to use the main features of Lifelines2 to find patients who experience reduced renal function as a result of adverse radiology contrast procedures. |
(.mp4) | ||
Medical Scenario:Heparin-induced thrombocytopenia (HIT) is characterized by >50% of platelet counts within 5-9 days after exposure to heparin. This is a dangerous condition. Physicians are interested in two questions: (1) Do HIT patients tend to stay in ICU longer? (2) How effective is the drug Argatroaan for HIT patients?
Demo Summary:This demonstration shows how to flexibly create groups and compare them using temporal summaries. We assume viewers are already familiar with the basic features of Lifelines2. |
(.mp4) | ||
Participants
- Taowei David Wang, Ph.D. Student, Computer Science
- Catherine Plaisant, Associate Research Scientist, UMIACS
- Ben Shneiderman, Professor, Computer Science
Publications
Journal paper on Lifelines2, with description of quasi-final interface
Taowei David Wang, Catherine Plaisant, Ben Shneiderman, Neil Spring, David Roseman, Greg
Marchand, Vikramjit Mukherjee,
and Mark Smith.
Temporal Summaries: Supporting Temporal
Categorical Searching, Aggregation and Comparison,
IEEE Transactions on Visualization and Computer Graphics, 15(6), 1049-1056,
November/December 2009.
Initial CHI paper Taowei David Wang, Catherine Plaisant, Alex Quinn, Roman Stanchak, Ben Shneiderman, and Shawn Murphy. Aligning Temporal Data by Sentinel Events: Discovering Patterns in Electronic Health Records, Proceedings of the ACM SIGCHI Conference on Human Factors in Computing Systems (CHI 2008).
Description of novel temporal search algorithm
Taowei David Wang,
Amol Deshpande, and Ben Shneiderman,
A Temporal Pattern Search Algorithm for Personal History Event Visualization,
IEEE Transactions on Knowledge and Data Engineering, vol.PP, no.99 (2009).
Design guidelines and description of process model for analysis of temporal
categorical data
Taowei David Wang, Krist Wongsuphasawat, Catherine Plaisant, and Ben Shneiderman,
Visual Information Seeking in Multiple Electronic Health Records: Design
Recommendations and a Process Model, Proceedings of the 1st ACM International
Informatics Symposium (IHI '10) (2010) 46-55.
Survey of visualization techniques for EHR data
Alexander Rind, Wolfgang Aigner, Silvia Miksch,
Taowei David Wang, Krist Wongsuphasawat, Catherine Plaisant, and Ben
Shneiderman,
Interactive Information Visualization for Exploring and
Querying Electronic Health Records: a Systematic Review.
Phuong Ho, Taowei David Wang, Krist Wongsuphasawat, Catherine Plaisant, Ben Shneiderman, Mark Smith, and David Roseman, Monitoring and Improving Quality of Care with Interactive Exploration of Temporal Patterns in Electronic Health Records .
Short paper for small local workshop
Taowei David Wang, Krist Wongsuphasawat, Catherine Plaisant, and Ben Shneiderman,
Exploratory Search Over Temporal Event Sequences: Novel Requirements,
Operations, and a Process Model, Proceedings of the third Workshop
on Human-Computer Interaction and Information Retrieval, 2009.
PhD Thesis dissertation on LifeLines2
Taowei David Wang,
Interactive Visualization Techniques for Searching Temporal Categorical Data,
Ph.D. Dissertation from the Department of Computer Science, May, 2010.
[available in UMD
Dissertation Archive]
LifeLines2 Links
Sponsors and Partners
We thank the National Institutes of Health (Grant RC1CA147489-02), the Washington Hospital Center and Harvard Medical School - Partners HealthCare for their partial support.
Other Related Projects from HCIL
LifeFlow: Visualization for Aggregated of Event Sequences over time.
Similan: Similarity search of temporal categorical data.
Lifelines: Visualizing patient records, criminal records, and personal histories.
PatternFinder: integrated interface for visual query and result-set visualization for search and discovery of temporal patterns within multivariate and categorical data sets.
PatternFinder in Azyxxi: Temporal Query Formulation and Result Visualization in Action
Related Workshops from HCIL
Personal Medical Devices Workshop: Increasing Patient Healthcare Participation (June 3, 2004)
Interactive Visual Exploration of Electronic Health Records (May 30, 2008)
Visualization for Electronic Health Records: Promoting Patient-Centered Cognitive Support for Physician Decision-Making (July 6, 2010)