| Overview |
| Client Application |
| QPC Console |
| System Requirements |
| Download |
| OnLine Help |
| Home |
The QPC Console of the Land Cover Visualization Tool

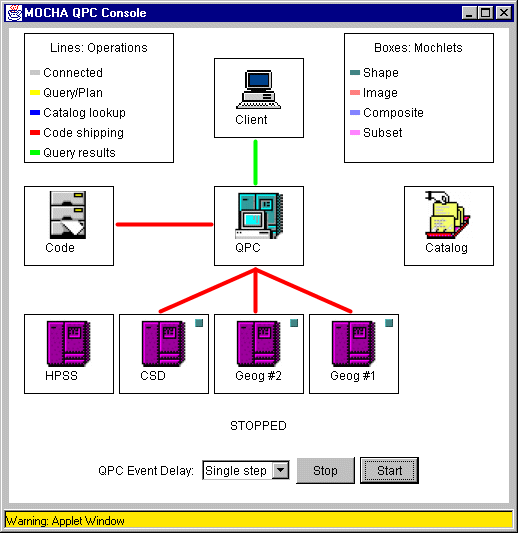
The QPC console visually shows the interactions within the MOCHA system. As actions are performed on the QPC, they are relayed back to the client and showed on the above window.
ICONS
The icons show the topology of the MOCHA system. There is an icon for the client, QPC (Query Processing Coordinator), code repository, system catalog, and one for each of the DAPs (Data Access Providers)
LINE COLORS
When connections are made to the various parts of the MOCHA system, a line is drawn to show what is being done. A gray line indicates that a connection is open. A yellow line shows a query or query plan being sent. A catalog lookup is shown with a blue line. When code is retrieved from the repository or shipped to a site, the line becomes red. Query results are shown with a green line.
MOCHLETS
When code is shipped and installed at a site, a small box appears in the icon to show which code segment has been installed. These pieces of code are called MOCHLETS. For example, in the picture above, three of the DAPs have MOCHLET installed. The color indicates which MOCHLET is installed as shown in the legend on the QPC console window.
EVENT DELAY
The actions that are shown on the QPC console window can be quite fast, so an artificial delay can be added to make it easier to see and explain the events that are happening. To add artificial delays, select a delay time in the combo box after "QPC Event Delay". These are listed as milliseconds the QPC will pause after displaying an event. Selecting "Single Step", will stop the QPC after each event. Click the "Start" button to step through each event. At any time, the "Stop" button can be pressed to freeze the QPC at it's current state. Press "Start" to continue.
PREVIOUS NEXT
© 2000 University of Maryland. All rights reserved.

