ManyLists: Product Comparison Tool Using Spatial Layouts with Animated Transitions
ManyLists is a product comparison tool that compares products' features using Spatial Layouts with Animated Transitions. We applied the design concept from our recent comparison tools: Twinlist. It aims to meet the following three goals: 1. Support the comparison of at least four products,each with dozens of attributes. 2. Provide an overview to help users spot products provide more desirable features with less effort. 3. Allow the customization of positive and negative features. We proposed three guidelines for designing similar Spatial Layouts with Animated Transitions systems: break multi-step processes into small comprehensible steps, show animated transitions for each step, and use spatial layouts to indicate relationships among features.
Project Description
ManyLists will support the following three types of applications:
- Vitamin supplements: here the features are lists of ingre- dients, available in a standard formats and measures. In almost every case having more of an ingredient is better.
- Food products: they have nutritional ingredients in mostly standard formats. For some ingredients more is better (e.g. fiber, potassium) but for other ingredients less is better (e.g. cholesterol, sodium). For some ingredients user preferences may vary (e.g. while calories are usually considered bad in wealthy countries, sometimes consumers want more calories, or more sugar).
- Technical products such as laptops: they have many features to compare, but formats are not standardized. Sometimes different brands might have different format for specfications. Numerical values such as hard disk size or RAM are comparable, but other features described are hard to compare.
ManyLists Design
In ManyLists, each feature of the products is classified as being either the same for all products, unique to a single product, or similar across multiple products. Features that are identical (i.e. the same) in all products are grouped together and placed on the top of the screen. Features that are unique to a product are listed at the bottom of the screen, one column per product. Features that exist in two or more products are aligned to facilitate comparison, and grouped in the center of the screen. Color-coding is used to help users compare the products along those features. For each feature we use a light green color to show the best value among the products. To attract users' attention to only the better features, we also soften the appearance all the less preferable values.
ManyLists starts off as standard multicolumn table view (Figure 1), where all the features of a product are put in the same column. The dataset we are using in the example is four different types of coffee. The nutritional ingredients are listed below each product.
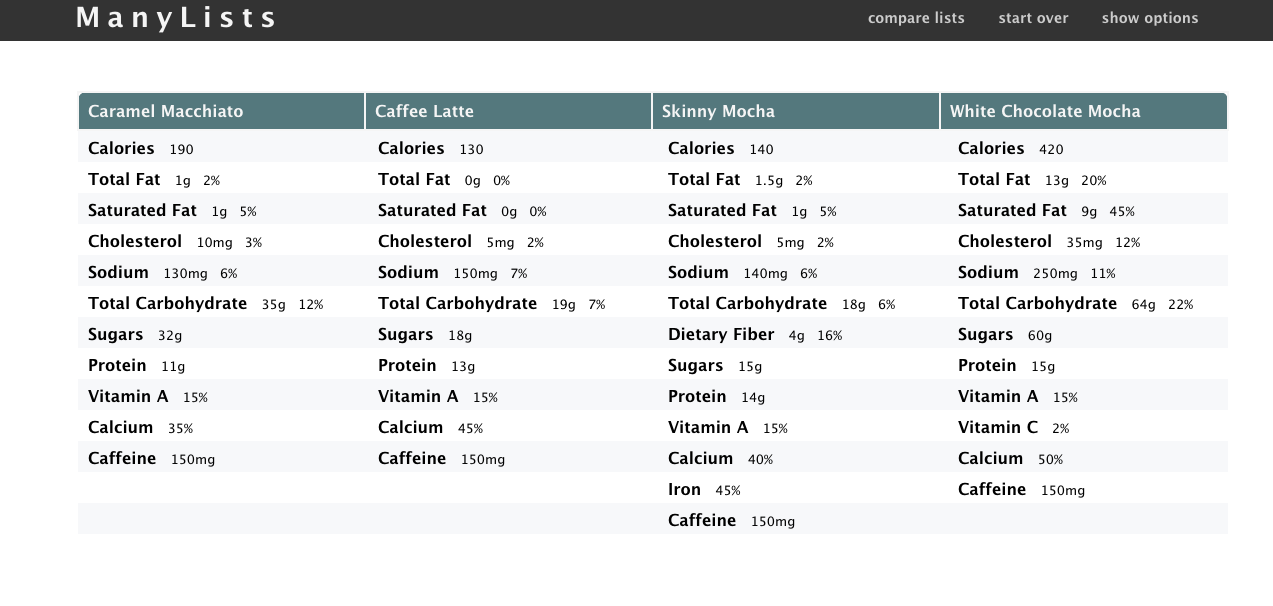
Figure 1: Initial layout: All features in the product column. Here four coffee drinks are compared. The feature lists of the four products are shown in four separate columns.
Features are the nutritional ingredients in each drink and they are unsorted by default.
Next, we find all the identical, similar and unique features of all four products in steps. Animation is used to guide user through this process. The animation consists of the following steps (Figure 2):
- The identical features fade out from their initial location and move one by one to their location in the top "identical" section.
- Unique features drop down to the bottom of their columns in the "unique" section.
- The similar elements are aligned, remaining in the middle of the screen.
- The empty rows are reclaimed to save screen space.
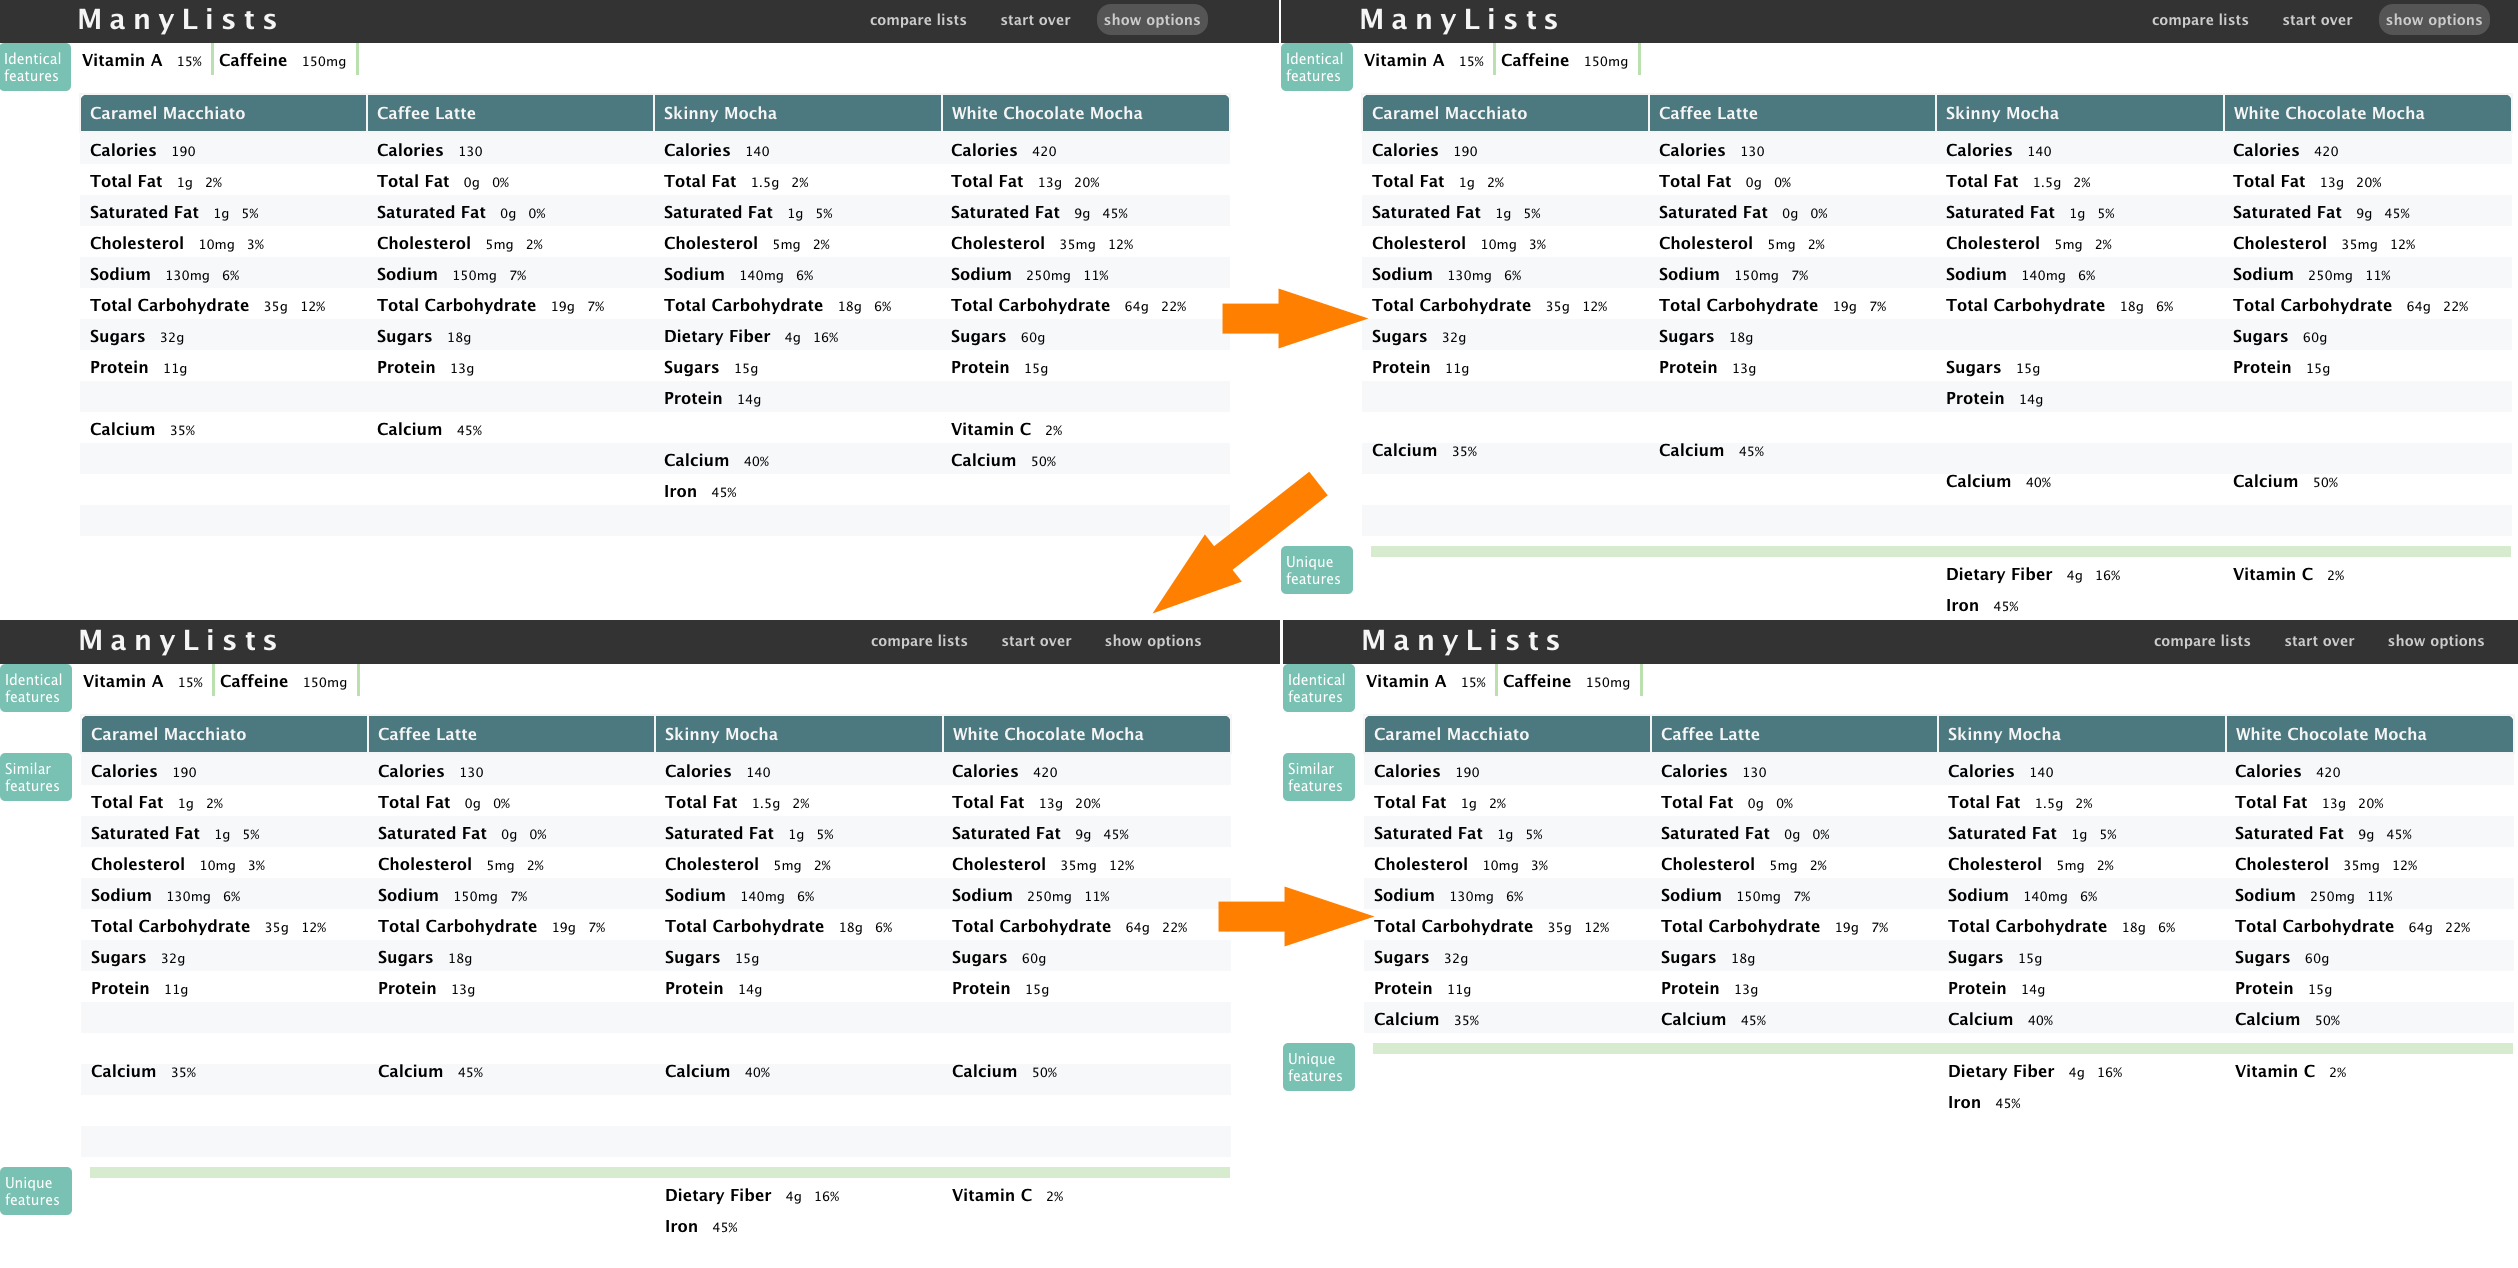
Figure 2: ManyLists animated transitions1) Push the identical features up. All the identical elements among all four lists are merged together in the top row
(e.g. Caffeine is the same in all four products so all four "caffeine 150mg" labels converge to the top to become a single label.)
2) Drop the unique features below. All the unique features are placed at the bottom in each column and a horizontal line separates them from the similar features. Practically all individual features slide down to their new place.
For example, only the fourth product has some Vitamin C so the label "Vitamin C" slide to the bottom of the fourth column.
3) Align the similar features across two or more products. Features that appear in more than 2 products are aligned.
A very light-colored horizontal striping background organizes the similar features, thereby facilitating comparison.
4) Compact the display. All the empty rows resulting from the earlier movements are removed, producing a more compact display.
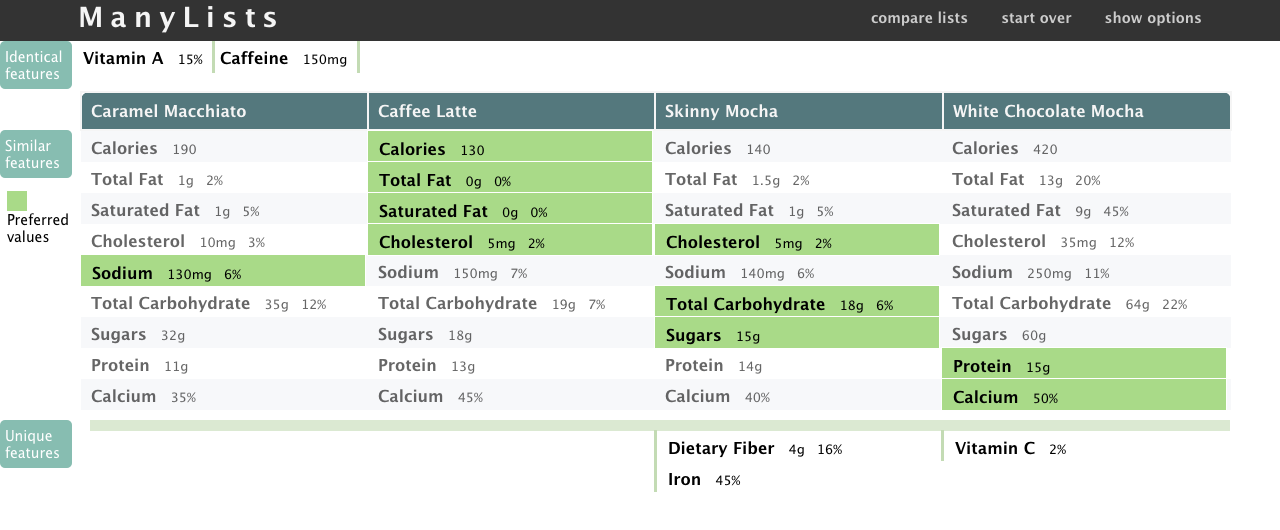
The last step is to highlight the preferred values among all the products. The lengend is shown and all the preferred values are highlighted in green while other values are grayed out.
Figure 3: Highlighting the best product for each feature. ManyLists highlights the best value for each feature in light green.
Another example is the comparison is technical products (Figure 4). In this example, we compared four different digital cameras. The identical features are too many to be displayed in one row, ManyLists will detect the overflow of the features and put an additional row for the identical features. Our tool works fine for the numerical feature values, it suggests the best feature values among the four products. However, it is difficult to work with text features values. For example, the processors feature, the values are "Digic 4", "Venus Engine FHD" and "TruePic V". It is very hard to suggest a best value. In the future, we will need to explore a way to represent text feature values.
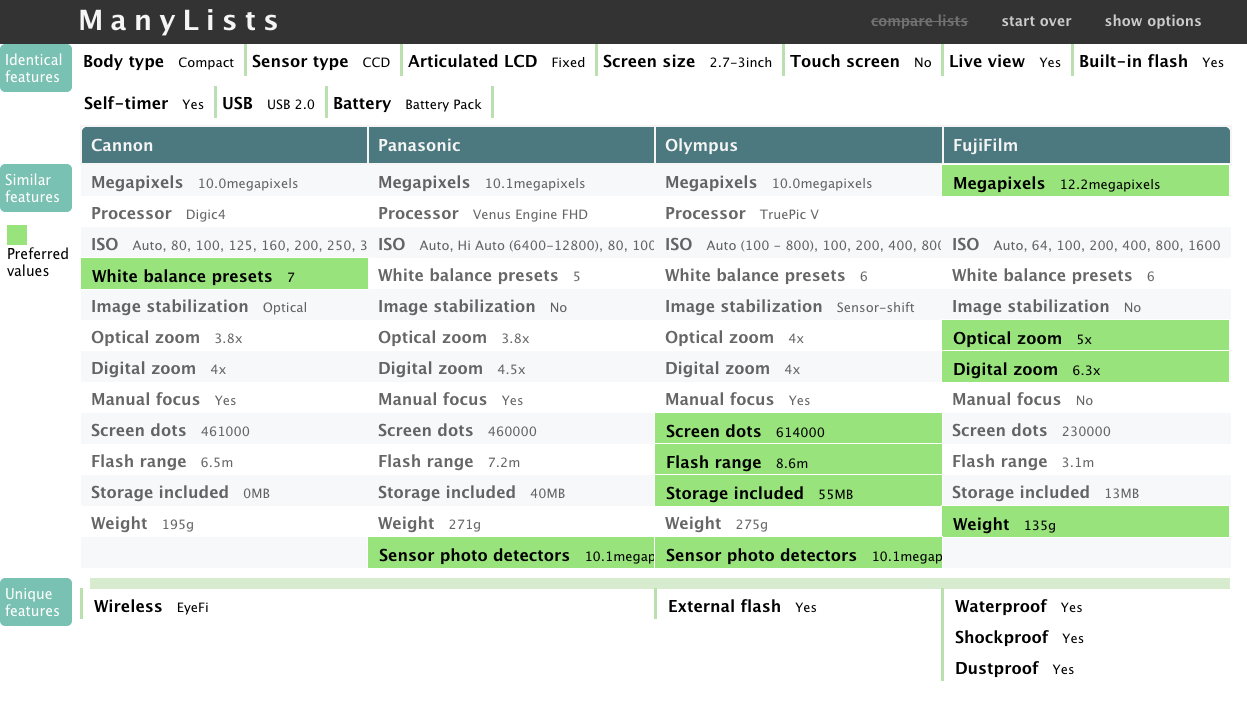
Figure 4: Comparison of four digital cameras : the identical features are too many to be displayed in one row. When this happens,
all the other features slide down, the remaining identical features align in the second row on the top of the page.
Customization
Since a small change in nutritional values can be considered as insignificant, we define a threshold of similarity to classify features as identical for all products, which reduces the number of features to compare. In ManyLists, users can adjust that threshold of similarity, e.g. they can specify that products that vary in calories count by less than 10% should be considered as identical. In the example in Figure 4, the screen size for the four digital cameras are: 3 inch, 3 inch, 3 inch, and 2.7 inch (the fourth feature in the first row of identical features region). Our threshold is set to be 10%, so in this case they are considered the same for all products. A range of "2.7-3 inch" is shown in the identical features on the top.
ManyLists also supports users changing the default settings of goodness of the feature, e.g. users who seek to lose weight will favor products with fewer calories, while users who are trying to gain weight will prefer more calories. The option panel that support customized actions is showed in Figure 5. Here in the option panel, users can customize the visualiza- tion to suit their needs.
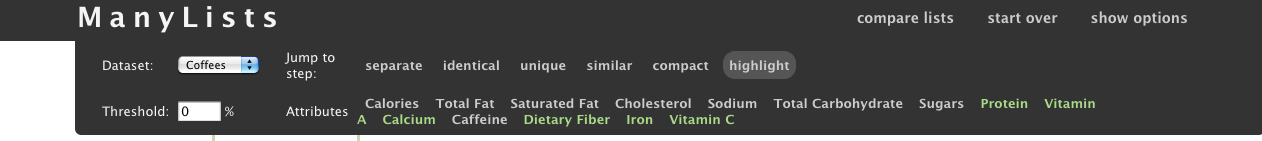
Figure 5: Option panel.:ManyLists allows users to change datasets, replay the lists-matching animation one step at a time,
change default threshold setting to consider the feature values that vary within a small range as identical features, and choose the desired/undesired features. The desired features are in green.
design guidelines
From our experiences, observations and the user study, we learned a few lessons for designing visualizations using Spatial Layouts with Animated Transitions. We generalized these lessons into the following three design guidelines for future developers.
- Break multi-step processes into small comprehensible steps.
- Show animated transitions for each step, which users can follow.
- Use spatial layouts to indicate relationships among features.
Video Demonstration
| Video | Description |
|---|---|
|
Summary Length: 1 minutes 14 seconds |
Participants
- Ran Liu, Master of Science, Computer Science
- Tiffany Chao, PhD Student, Computer Science
- Dr. Catherine Plaisant
- Dr. Ben Shneiderman
Publications
Ran Liu, Tiffany Chao, Catherine Plaisant and Ben Shneiderman
ManyLists : Product Comparison Tool Using Spatial Layouts with Animated Transitions
Technical Report, University of Maryland, 2012. (Under review)
