Catherine Plaisant
March 1st, 2016: THIS PAGE IS NOT UPDATED ANYMORE. YOU SHOULD BE REDIRECTED TO THIS NEW URL: http://hcil.umd.edu/catherine-plaisant/. Follow that link if needeed.Catherine Plaisant is a Senior Research Scientist at the University of Maryland Institute for Advanced Computer Studies and Associate Director of Research of the Human-Computer Interaction Lab. Catherine Plaisant earned a Doctorat d'Ingenieur degree in France (similar to a Industrial Engineering PhD). In 1988 she joined Professor Ben Shneiderman at the Human-Computer Interaction Laboratory where she now enjoys working with multidisciplinary teams on designing and evaluating new interface technologies that are useful and usable. She was elected to the SIGCHI Academy in 2015.
Catherine Plaisant has over 140 published papers, on subjects as diverse as information visualization, medical informatics, universal access, digital humanities, technology for families, and evaluation methodologies. With Ben Shneiderman she co-authored the 4th and 5th Editions of Designing the User Interface, one of the major books on Human-Computer Interaction.
Research contributions range from focused user interaction techniques (e.g. Excentric Labeling) to innovative visualizations (such as LifeLines or EventFlow for the analysis of temporal records or SpaceTree for hierarchical data exploration) and interactive search interface techniques such as Query Previews. Those interaction techniques have been carefully validated with user studies and are finding applications in industry, government information systems and digital libraries.
Need (a lot) more? Resume

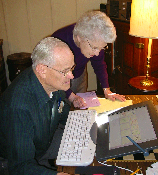
Click to enlarge
and other picturesContact information
Email: plaisant@cs.umd.edu
Tel: +1 (301) 405-2768, Fax (if you alert me first): +1 (301) 405-6707
Surface mail address: 2117C Hornbake South Wing, 4130 Campus Dr. University of Maryland, College Park, MD 20742, U.S.A.
Coming to visit? see directions to HCIL** News **
Now working on the 6th edition of Designing the User Interface - In bookstores near you Spring 2016. 6/2015: Story on our Twinlist prototype for medication reconciliation appears in User Experience, the Magazine of the User Experience Professionals Association.
12/10/2014: I was elected to the SIGCHI Academy, an ACM award, thank you, and see you for the party in Seoul!
Previous news entries... Publications and projects
.Publications: See Resume or you can also look for early online versions of the papers by searching for "plaisant" in the HCIL Tech Report database
Designing the User Interface, 5th ed. (2009)
by Shneiderman, Plaisant, Cohen, Jacobs
(now working on 6th edition!)
Inspired EHRs: Designing for Clinicians (2014)
by Belden, Patel, Lowrance, Plaisant et al.
(eBook)

State of the Field and New Research Directions, Information Visualization, 10(4), 2011.
Guest Editors: Catherine Plaisant, Andreas Kerren, Stasko
Evaluation of Visual Analytics, IEEE Computer Graphics and Applications (May/June 2009).
Guest Editors: Catherine Plaisant, Jean Scholtz and Georges GrinsteinSpecial Issue in Honor of Ben Shneiderman's 60th Birthday: Reflections on Human-Computer Interaction,
International Journal of Human-Computer Interaction, 23, 3 (2007),
Guest Editors: Catherine Plaisant, Chris North
Participation in the Center for Advanced Transportation Technology (CATT lab) design activities. See the CATT lab portfolio. 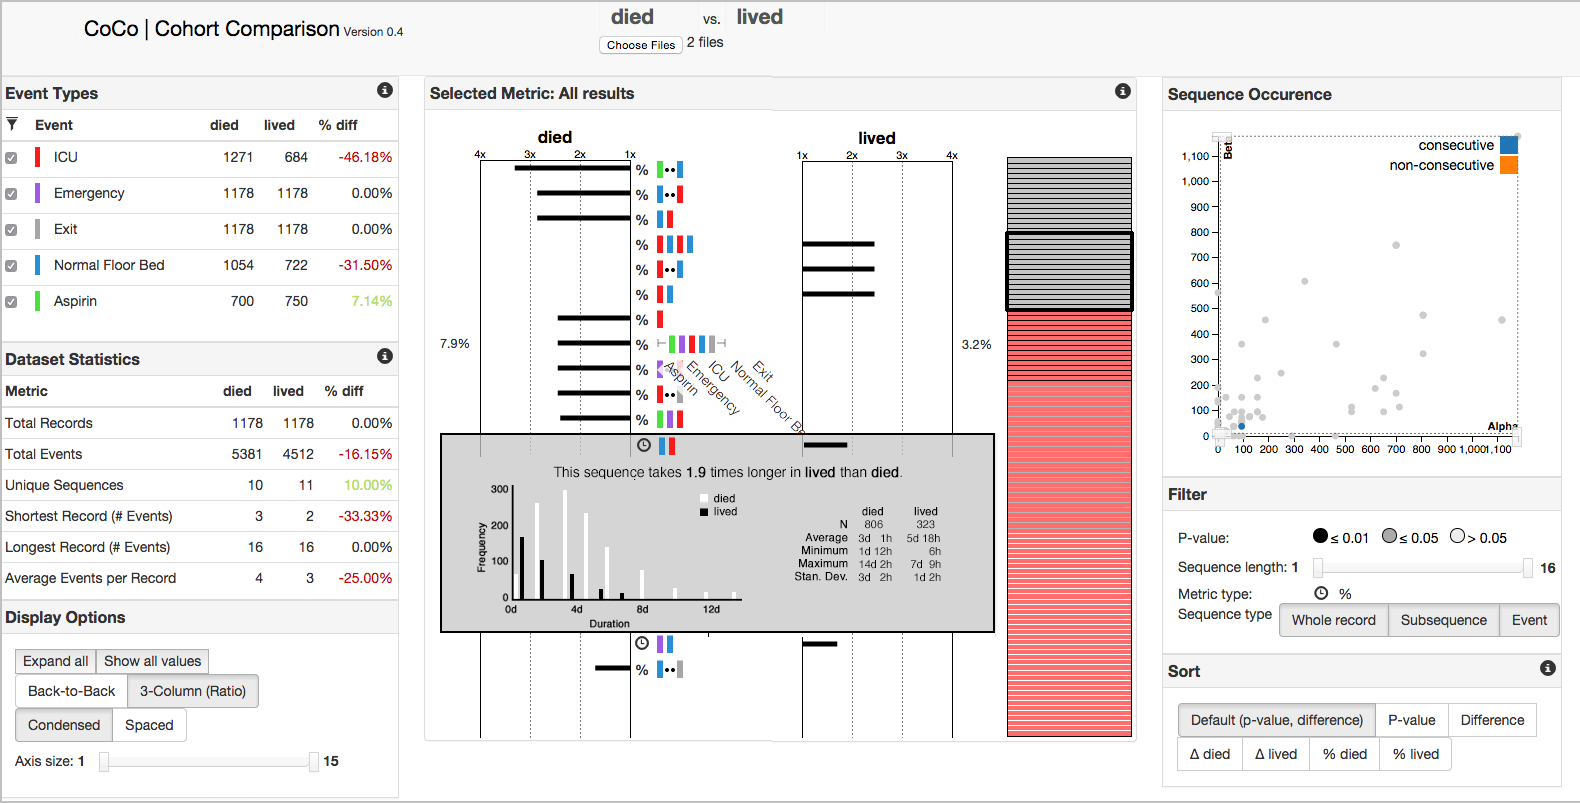
CoCo (short for COhort COmparison) helps analysts compare the event sequences found in 2 groups of records e.g. patients. 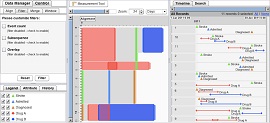
EventFlow, for exploration of temporal patterns in sequences of events. Builds on LifeLines2 and Lifeflow, but now with interval data and enhanced search and simplification capabilities.
[Video by Megan Monroe]

SHARP-C project: Novel interfaces for clinicians. We are looking at the problems of medication reconciliation, missed labs and wrong patient selection. Our Maryland project is part of the National Center for Cognitive Informatics and Decision Making in Healthcare (NCCD) led by The University of Texas Health Science Center at Houston.
E.g. VIDEO of Twinlist for medication reconciliation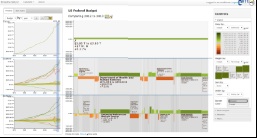
Treeversity: Visualizing Changes Over Time Using Dynamic Hierarchies. Users can analyze relative and absolute change over one variable in each node, as well as created and removed nodes. They cab also compare non-inherently hierarchichal datasets, by grouping them by attributes. 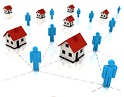
Community Analysis and Visualization for "Nation of Neighbors"; looking at social network analysis 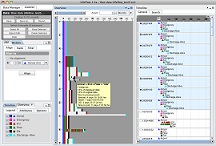
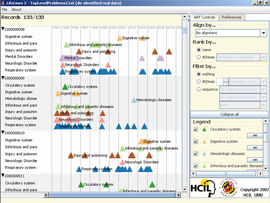
LifeFlow, for summarizing temporal sequences of events. Applications to Electronic health records, transportation incidents, web logs etc. 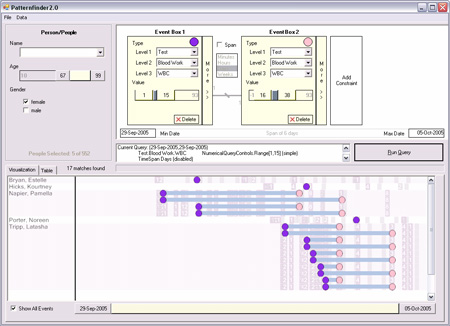
LifeLines2, Patternfinder (and now Patternfinder in Azyxxi): Interfaces for searching temporal categorical data, visually explore results and look for potential cause and effect. Our focus is on Electronic Health Records.
[Video by David Wang]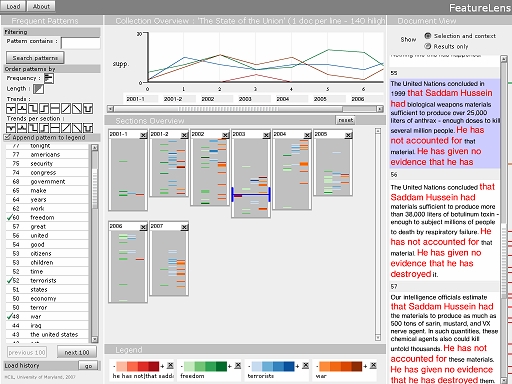
FeatureLens : we worked with literary scholars to develop a tool for exploring patterns of repetitions in text collections. This is part of the larger MONK project. 
VISUAL ANALYTICS EVALUATION: The NSF SEMVAST project seeks to develop benchmarks datasets and metrics for evaluation. To encourage researchers to work on realistic problems and test the tools they develop, I co-chair the VAST 2010 Challenge, which follows the 2009 Challenge, 2008 Challenge, and the 2007 and 2006 contests, all organized in conjunction with the IEEE Visual Analytics symposium . 
MONK is a large multi-institution project whose goal is to design and develop a digital environment helping humanities scholars discover and analyze patterns in the large collections of texts they study, using data mining and visualization. It continues the the NORA project. See JCDL paper nominated for Best Paper award (or the related HCIL project highlight ) or the FeatureLens and BasketLens projects 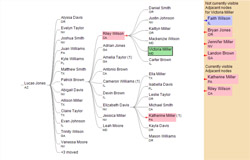
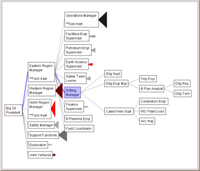
TreePlus, for browsing graphs using a tree layout, with an emphasis on readability. It was used to display social networks and food webs.
[Video]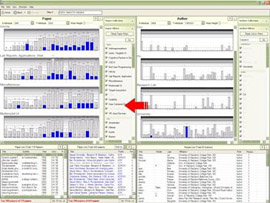
NetLens for iterative querying of bipartite graphs such of bibliographic data or email collections.
[Video]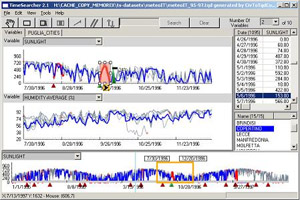
TimeSearcher for exploration of time series. 
Information Visualization Benchmarks Repository and
the InfoVis CONTESTS we ran in 2003 and 2004.Integration of Data and Interfaces to Enhance Human Understanding of Government Statistics. A collaborative project with University of North Carolina. Our motto: "Find what you need, understand what you found". We worked on diverse topics but my main focus was on new methods for helping novice users get started with complex interfaces, dealing with missing data, and improving accessibility to blind users (see the project below) 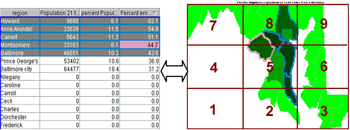
iSonic: making georeferenced data accessible to users with visual impairments
[Video by Haixia Zhao]Interliving: New Technology for Families. In particular we developed and evaluated to share calendar information between intergenerational family members, using digital pen technology. Treemap 4: New development in hierarchical information visualization with Treemap SpaceTree: a scalable and searchable hierarchical information browser
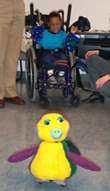
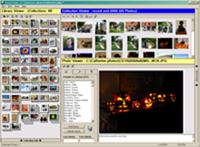
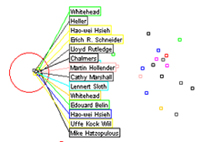
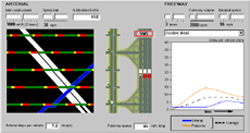
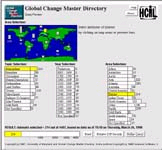
VIDEOA story telling robot for children in rehabilitation. PhotoFinder: Personal Photo Libraries Excentric Labeling for Information Visualization User interfaces for highway traffic management. In collaboration with the Center for Advanced Transportation Technology. Dynamic Queries and Query Preview Interfaces. Looked at how to avoid zero-hit queries with dynamic previews of the data available. In collaboration with NASA EOSDIS. Later on some of those ideas were applied in the user interfaces of the Global Land Cover Facility, and influenced the development of faceted search now common in many interfaces.
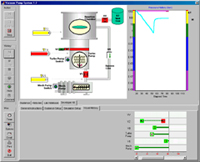
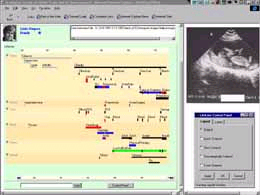
[VIDEO]Learning Histories for Simulation-based engineering education environments LifeLines for Visualizing Medical Patient Records (and other personal histories)
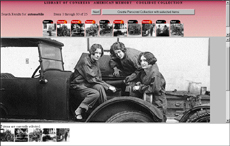
[VIDEO]User Interfaces for the Library of Congress National Digital Library. How to "bring treasures to the surface" in the design of Digital Libraries.
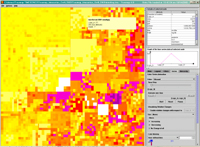
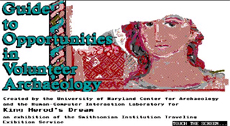
See also WebTOC: a Tool to Visualize and Quantify Web Sites using a Hierarchical Table of ContentsUser Interfaces for the Visible Human Project (1992-93) Cancer Atlas: Dynamic Queries on a choropleth map [6:43 on the video] High precision touchscreens, Information Kiosks, Home Automation (Summary)
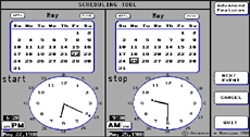
e.g. [Video] of the Scheduler.Touchscreen ON/OFF switches (see HCIL touchscreen research summary)
[VIDEO]Hypertext research (my first project at HCIL in 1987!)
. Role Management as a guiding concept for the next generation of user interfaces (Summary) . User interfaces for Youth Services Information Systems . Network Management (Summary)