The program has a Multiple Document Interface, consisting of a Network Window displaying the Topology View and the Traffic View, and a Graphic Window for displaying computed metrics.
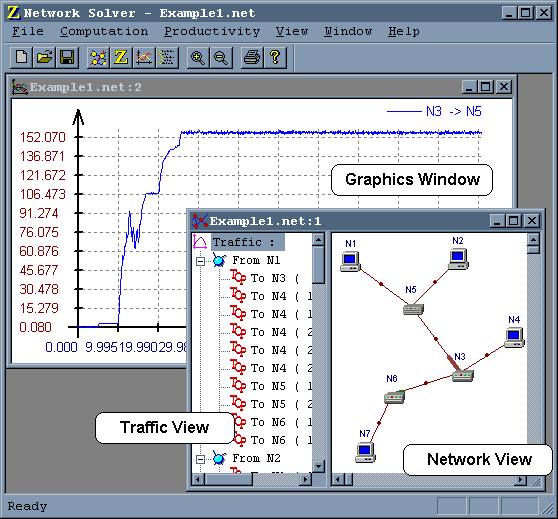
The Traffic View displays the nodes and the traffic. Here the user can delete and modify nodes and traffic classes.
The Graphics Window displays computed metrics as plots. To display a graph the user should first compute the metrics.
The topology of the network and the graphics can be printed or saved in metafiles (metafiles can be included in documents; the program has no OLE support).